Divorce rates differ from state to state and unfortunately, some states are a little higher than others. And although we have fairly accurate scientific surveys — such as the American Community Survey used below — there isn’t one singular source of information that can effectively tell the entire story of divorce in the United States and why certain states fare better than others.
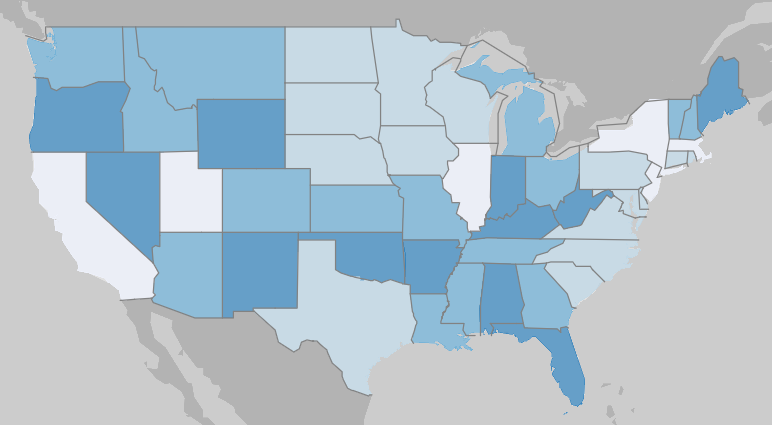
However, there are several data sources and tools that can be used to examine the issue, and some, like the U.S. Census Data Profile Mapper (as seen below), can be used to effectively visualize marriage and divorce for any state and/or territory in the United States.
By understanding marital status, divorce, and marital history, federal agencies and other organizations can forecast future trends, identify spousal program needs, reevaluate financial assistance programs and tax policies, and effectively measure programs that have a direct effect on the well-being of families.
Use the data and maps below to explore marriage and divorce rate by state for the entire U.S. Compare the information below, see why some states are higher than others, and the difference between male and female divorce rates. Pair these maps with other interactive demographic and social tools to explore the issue further.
Divorce Rate by State (to include DC and Puerto Rico)
| Rank | State | Population (15 Years and Older) | Currently Divorced | Currently Married | Currently Widowed | Currently Separated | Never Married |
|---|---|---|---|---|---|---|---|
| 1 | Puerto Rico | 2,833,104 | 14.7% | 31.9% | 8.1% | 2.1% | 43.2% |
| 2 | Arkansas | 2,445,206 | 13.3% | 48.9% | 6.6% | 2.1% | 29.2% |
| 3 | West Virginia | 1,486,191 | 13.3% | 49.3% | 7.3% | 1.3% | 28.7% |
| 4 | Maine | 1,168,883 | 13.2% | 51.6% | 5.8% | 0.8% | 28.6% |
| 5 | Nevada | 2,567,541 | 12.8% | 45.1% | 5.4% | 1.8% | 35.0% |
| 6 | New Mexico | 1,728,213 | 12.8% | 44.7% | 5.7% | 1.6% | 35.1% |
| 7 | Oregon | 3,540,546 | 12.7% | 48.8% | 4.9% | 1.3% | 32.5% |
| 8 | Kentucky | 3,672,905 | 12.6% | 49.0% | 6.6% | 1.8% | 29.9% |
| 9 | Oklahoma | 3,195,710 | 12.6% | 48.9% | 6.3% | 1.8% | 30.4% |
| 10 | Florida | 18,251,571 | 12.5% | 47.4% | 6.4% | 1.9% | 31.7% |
| 11 | Indiana | 5,500,676 | 12.5% | 49.2% | 5.7% | 1.1% | 31.4% |
| 12 | Wyoming | 471,226 | 12.3% | 53.8% | 5.0% | 1.4% | 27.5% |
| 13 | Alabama | 4,113,516 | 12.2% | 47.1% | 7.1% | 1.9% | 31.7% |
| 14 | Idaho | 1,515,845 | 11.9% | 54.8% | 4.8% | 1.1% | 27.4% |
| 15 | Montana | 910,599 | 11.9% | 50.9% | 5.4% | 1.2% | 30.6% |
| 16 | Ohio | 9,636,748 | 11.9% | 47.2% | 6.0% | 1.5% | 33.4% |
| 17 | Tennessee | 5,707,432 | 11.9% | 48.8% | 6.3% | 1.9% | 31.1% |
| 18 | Missouri | 5,026,699 | 11.8% | 49.4% | 6.0% | 1.7% | 31.1% |
| 19 | Louisiana | 3,725,807 | 11.7% | 43.5% | 6.3% | 2.2% | 36.4% |
| 20 | New Hampshire | 1,180,473 | 11.7% | 51.4% | 5.2% | 1.2% | 30.6% |
| 21 | Arizona | 5,951,507 | 11.6% | 48.7% | 5.1% | 1.5% | 33.1% |
| 22 | Michigan | 8,287,187 | 11.5% | 47.7% | 5.7% | 1.2% | 33.9% |
| 23 | Mississippi | 2,382,518 | 11.5% | 44.5% | 6.9% | 2.5% | 34.6% |
| 24 | Vermont | 550,276 | 11.4% | 49.4% | 5.3% | 0.9% | 32.9% |
| 25 | Washington | 6,346,203 | 11.4% | 50.7% | 4.4% | 1.3% | 32.2% |
| 26 | Alaska | 581,897 | 11.3% | 49.0% | 4.2% | 1.8% | 33.6% |
| 27 | Georgia | 8,731,410 | 11.3% | 46.5% | 5.2% | 1.8% | 35.2% |
| 28 | Colorado | 4,793,694 | 11.1% | 50.2% | 4.1% | 1.2% | 33.3% |
| 29 | Kansas | 2,588,040 | 11.0% | 51.4% | 5.7% | 1.2% | 30.7% |
| 30 | Rhode Island | 925,558 | 10.8% | 44.9% | 5.5% | 1.5% | 37.4% |
| 31 | Wisconsin | 4,852,416 | 10.8% | 49.9% | 5.2% | 0.9% | 33.2% |
| 32 | North Carolina | 8,660,874 | 10.7% | 48.5% | 5.7% | 2.2% | 32.9% |
| 33 | Iowa | 2,588,040 | 10.5% | 51.2% | 5.5% | 1.1% | 31.7% |
| 34 | South Carolina | 4,276,713 | 10.5% | 47.9% | 6.6% | 2.2% | 32.8% |
| 35 | Connecticut | 3,018,535 | 10.4% | 46.9% | 5.4% | 1.4% | 35.9% |
| 36 | Nebraska | 1,563,814 | 10.4% | 52.3% | 5.2% | 1.0% | 31.2% |
| 37 | Minnesota | 4,628,858 | 10.1% | 50.8% | 4.8% | 0.9% | 33.3% |
| 38 | Virginia | 7,088,043 | 10.0% | 49.5% | 5.3% | 1.9% | 33.3% |
| 39 | Delaware | 832,027 | 9.9% | 48.1% | 6.3% | 1.6% | 34.1% |
| 40 | South Dakota | 711,925 | 9.9% | 51.4% | 5.5% | 1.2% | 32.0% |
| 41 | Texas | 23,373,981 | 9.9% | 49.7% | 4.8% | 2.1% | 33.4% |
| 42 | Maryland | 5,042,297 | 9.8% | 47.5% | 5.4% | 1.8% | 35.6% |
| 43 | North Dakota | 620,127 | 9.8% | 50.2% | 5.2% | 1.0% | 33.8% |
| 44 | Pennsylvania | 10,766,654 | 9.7% | 48.1% | 6.1% | 1.7% | 34.4% |
| 45 | Illinois | 10,376,721 | 9.6% | 47.4% | 5.5% | 1.5% | 36.1% |
| 46 | Hawaii | 1,184,801 | 9.4% | 50.0% | 5.7% | 0.9% | 34.0% |
| 47 | District of Columbia | 559,673 | 9.3% | 30.2% | 3.8% | 1.3% | 55.3% |
| 48 | Massachusetts | 5,871,307 | 9.2% | 46.6% | 5.1% | 1.5% | 37.5% |
| 49 | New York | 16,443,249 | 9.1% | 44.4% | 5.6% | 2.2% | 38.7% |
| 50 | California | 32,021,241 | 8.9% | 46.4% | 4.6% | 1.9% | 38.2% |
| 51 | Utah | 2,561,556 | 8.6% | 55.3% | 3.5% | 1.2% | 31.5% |
| 52 | New Jersey | 7,606,368 | 8.5% | 49.9% | 5.5% | 1.7% | 34.4% |
| United States | 271,400,195 | 10.60% | 48.0% | 5.5% | 1.7% | 34.2% |
Divorce Rates by Age for Males
| Age | Population (Male) | Divorced | Married | Widowed | Separated | Never Married |
|---|---|---|---|---|---|---|
| 15 and up | 133,358,219 | 9.2% | 49.7% | 2.6% | 1.5% | 37.1% |
| 15 – 19 | 11,171,156 | 0.0% | 1.0% | 0.0% | 0.1% | 98.9% |
| 20 – 34 | 33,732,864 | 2.2% | 25.4% | 0.1% | 0.8% | 71.6% |
| 35 – 44 | 22,024,008 | 8.8% | 59.8% | 0.4% | 2.1% | 28.9% |
| 45 – 54 | 20,286,006 | 14.2% | 65.3% | 1.0% | 2.3% | 17.2% |
| 55 – 64 | 20,952,443 | 16.4% | 65.9% | 2.4% | 2.1% | 13.2% |
| 65 and up | 25,191,742 | 12.9% | 68.7% | 10.3% | 1.3% | 6.8% |
Divorce Rates by Age for Females
| Age | Population (Female) | Divorced | Married | Widowed | Separated | Never Married |
|---|---|---|---|---|---|---|
| 15 and up | 138,041,976 | 9.2% | 49.7% | 2.6% | 1.5% | 37.1% |
| 15 – 19 | 10,652,932 | 0.0% | 1.1% | 0.0% | 0.1% | 98.8% |
| 20 – 34 | 32,728,917 | 3.2% | 32.3% | 0.2% | 1.4% | 63.0% |
| 35 – 44 | 21,709,553 | 11.4% | 61.4% | 0.9% | 3.0% | 23.3% |
| 45 – 54 | 20,387,711 | 17.7% | 62.9% | 2.4% | 3.2% | 13.8% |
| 55 – 64 | 21,862,591 | 19.8% | 60.2% | 7.0% | 2.5% | 10.6% |
| 65 and up | 30,700,272 | 16.7% | 46.2% | 29.8% | 1.2% | 6.2% |
Census Data Profile Mapper — is a new platform designed for everyday users of data and information. You can access digital data and content from the United States Census Bureau using one centralized system. With the information all in one place, it’s easy to search for any and all census and ACS information with user-friendly tables and maps. Click the image to explore more.
Millennial Cities
Want free articles, news, tools, and information? Subscribe below and we’ll add you to the list!