wetlands in the United States

Use a Wetlands Map to Visualize the State of American Wetlands

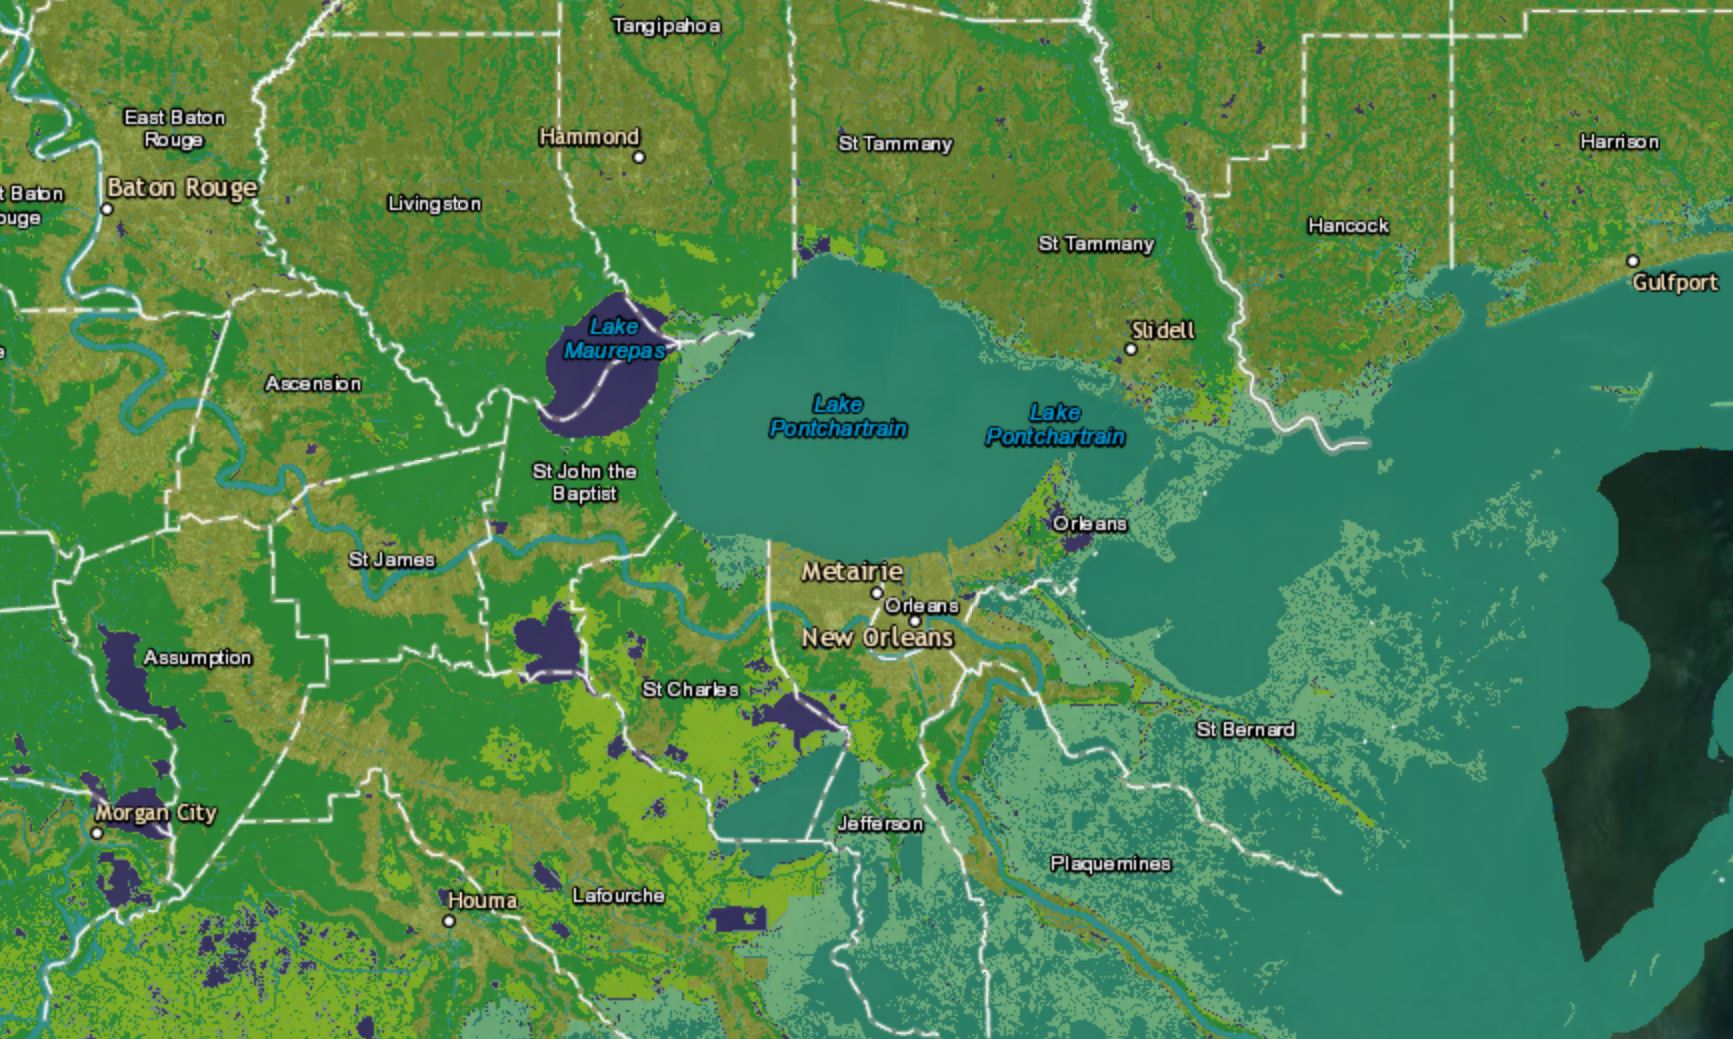
The U.S. Fish and Wildlife Service (USFWS) is the main federal organization responsible for providing the United States and its Trust Territories with geospatial data on wetlands and related aquatic environments. Similar to other federal agencies, the USFWS provides a stewardship of their data through the National Wetlands Inventory, making wetland information accessible to the …

homelessness found throughout the United States

Homeless Population by State: Homelessness Maps

Homelessness is a complex issue and there isn’t one singular piece of data that can effectively tell the entire story of homelessness and the greater need for housing in the United States. However, there are several data sources and tools that can be used at the community level to address the issue and some, like …

health inequality

Medically Underserved Areas Map Shows Vulnerable and Underserved Populations

Medically underserved areas (MUA) are areas where certain populations — usually rural — are subject to a lack of primary care and have high levels of poverty, infant mortality, and elderly people. As designated by the Health Resources and Services Administration (HRSA), these “shortage areas” can have both a “population” and “geographic” identify. For example, …

Find a garden

Want to Start a Community Garden? Check out These Maps First

Community gardens are collaborative projects where neighbors come together and grow fruits, vegetables, and other plants in an accessible and open-space environment. As a gathering space, not only do they strengthen and build community pride, but they allow others to visibly see what a healthy, urban environment of stewardship and cooperation really looks like. Traditionally, …

shows total driving costs in Atlanta

The Cost of Driving is WAY Higher Than You Think

As a general rule of thumb, transportation costs are supposed to be less than 15% of your annual income — that means that for a typical household in the U.S., with an income around $53,889, expenses should come out to about $8,083 a year or $674 a month. However, as outlined with the tools below, …

interactive social justice tool

Interactive Social Justice Tools For Learning, Teaching, and Planning

Interactive social justice tools are out there, but they’re pretty hard to find. Sometimes, they’re a little too teacher-based and reactive in nature, and other times, they’re really good, but completely unknown to the average observer and scattered across the internet. Lucky for you, however, we’ve compiled a list of the best and most useful …

gerrymandering in florida

Use These Interactive Tools To Better Understand Gerrymandering

Gerrymandering is the process of manipulating an electoral boundary to favor one political party’s interest over another. For example, if you have a state where 30% of the population is Republican and 70% of the population is Democrat, a gerrymandered state (in this situation) would mean that Republicans control the majority of districts despite the …

NYC Environmental Justice

EPA EJSCREEN: The Environmental Justice Screening and Mapping Tool

EPA EJSCREEN: The Environmental Justice Screening and Mapping Tool: Article by John Garner According to the Environmental Protection Agency (EPA), environmental justice is defined as the “fair treatment and meaningful involvement of all people regardless of race, color, national origin, or income, with respect to the development, implementation, and enforcement of environmental laws, regulations, and …

bias in the media

Use This Media Bias Chart To Determine News Reliability

In an era of social media and 24-hour news, it’s hard to differentiate between what’s reliable and what isn’t. Fortunately for us, however, Ad Fontes Media and creator Vanessa Otero are trying to change that. Creating the Media Bias Chart in 2016, Vanessa Otero has steadily built the once static chart into a fully interactive …