Homelessness is a complex issue and there isn’t one singular piece of data that can effectively tell the entire story of homelessness and the greater need for housing in the United States.
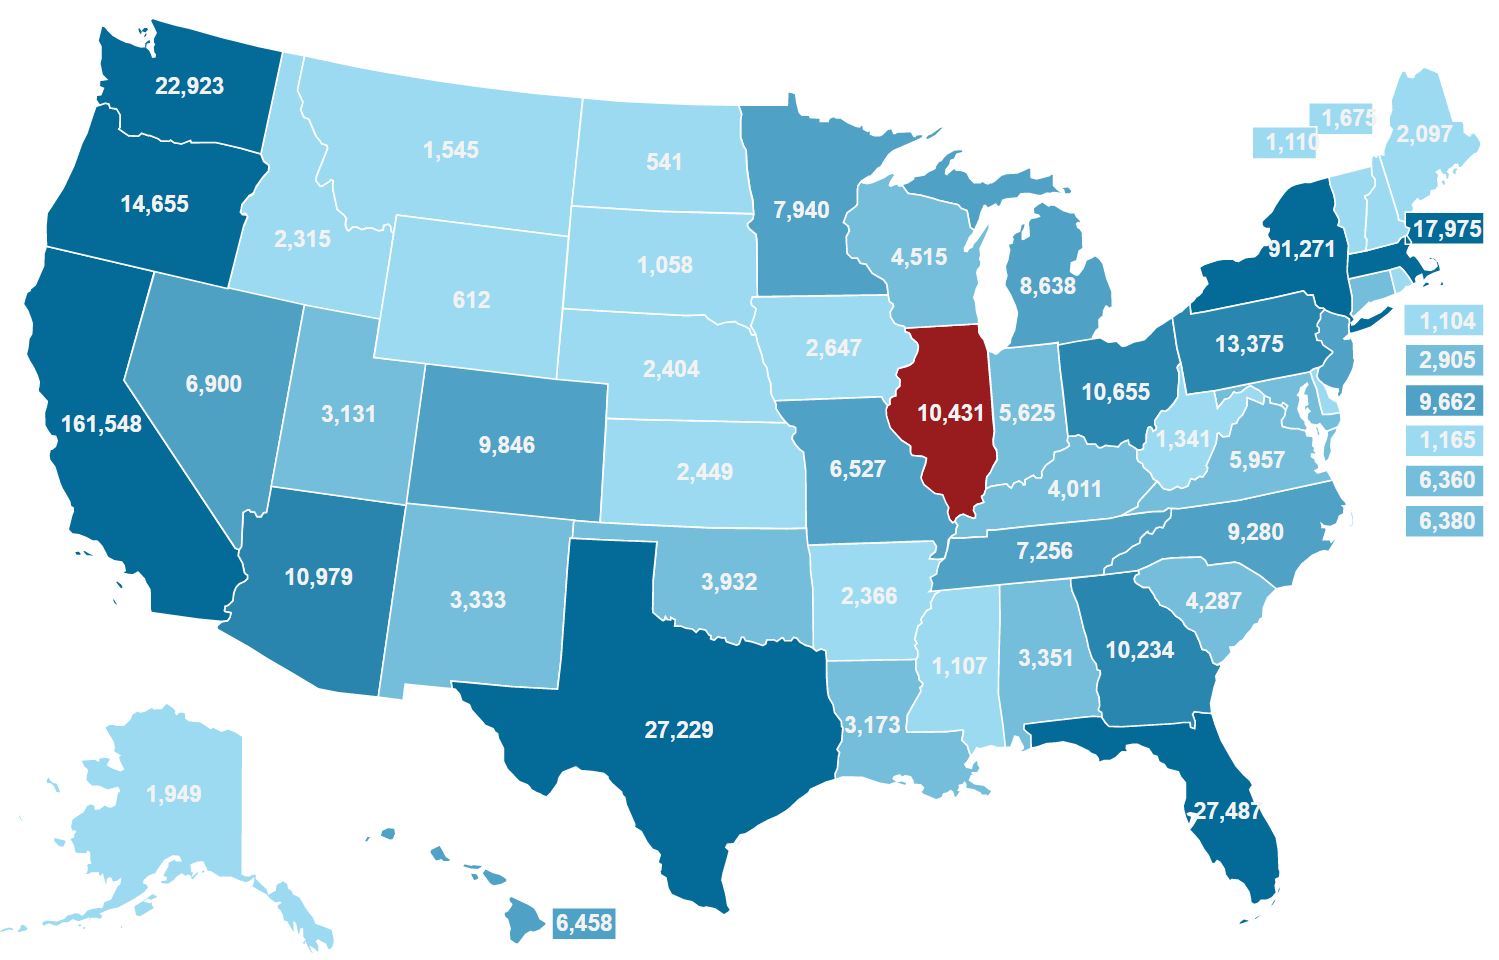
However, there are several data sources and tools that can be used at the community level to address the issue and some, like the USICH Homeless Population by State map, can be used to effectively visualize a large swath of homelessness data for any state and/or territory in the United States.
By using data, communities can engage in a collaborative decision-making process while also addressing wider needs, gaps in funding, and existing resources.
Use the data and maps below to explore homelessness and homeless population by state for the U.S. See why equity vs equality matters, what populations are most affected, and how the data is collected and used. Pair these maps with other interactive demographic tools to explore the issue further.
What State has the Highest Homeless Population?
| Rank | State | Total Homeless | Total Homeless as % | Total Family Households Experiencing Homelessness | Veterans Experiencing Homelessness | Persons Experiencing Chronic Homelessness | Unaccompanied Young Adults (Aged 18-24) Experiencing Homelessness |
| 1 | California | 161,548 | 27.89 | 8,030 | 11,401 | 51,785 | 12,172 |
| 2 | New York | 91,271 | 15.76 | 15,151 | 1,251 | 7,515 | 3,072 |
| 3 | Florida | 27,487 | 4.75 | 2,294 | 2,436 | 5,182 | 1,331 |
| 4 | Texas | 27,229 | 4.7 | 1,912 | 1,948 | 4,033 | 1,408 |
| 5 | Washington | 22,923 | 3.96 | 2,116 | 1,607 | 6,756 | 1,777 |
| 6 | Massachusetts | 17,975 | 3.1 | 3,714 | 836 | 2,042 | 481 |
| 7 | Oregon | 14,655 | 2.53 | 825 | 1,329 | 4,339 | 1,314 |
| 8 | Pennsylvania | 13,375 | 2.31 | 1,550 | 977 | 1,772 | 716 |
| 9 | Arizona | 10,979 | 1.9 | 809 | 921 | 2,086 | 633 |
| 10 | Ohio | 10,655 | 1.84 | 906 | 730 | 753 | 736 |
| 11 | Illinois | 10,431 | 1.8 | 1,063 | 736 | 2,305 | 671 |
| 12 | Georgia | 10,234 | 1.77 | 864 | 764 | 1,374 | 504 |
| 13 | Colorado | 9,846 | 1.7 | 665 | 1,044 | 2,954 | 562 |
| 14 | New Jersey | 9,662 | 1.67 | 1,081 | 595 | 1,743 | 514 |
| 15 | North Carolina | 9,280 | 1.6 | 809 | 798 | 1,272 | 485 |
| 16 | Michigan | 8,638 | 1.49 | 1,026 | 639 | 1,109 | 484 |
| 17 | Minnesota | 7,940 | 1.37 | 967 | 315 | 1,787 | 746 |
| 18 | Tennessee | 7,256 | 1.25 | 508 | 570 | 1,153 | 353 |
| 19 | Nevada | 6,900 | 1.19 | 159 | 924 | 1,369 | 570 |
| 20 | Missouri | 6,527 | 1.13 | 704 | 453 | 1,090 | 664 |
| 21 | Hawaii | 6,458 | 1.11 | 499 | 485 | 1,678 | 299 |
| 22 | District of Columbia | 6,380 | 1.1 | 767 | 302 | 1,452 | 253 |
| 23 | Maryland | 6,360 | 1.1 | 616 | 464 | 1,397 | 227 |
| 24 | Virginia | 5,957 | 1.03 | 621 | 395 | 813 | 234 |
| 25 | Indiana | 5,625 | 0.97 | 482 | 530 | 403 | 266 |
| 26 | Wisconsin | 4,515 | 0.78 | 558 | 337 | 611 | 193 |
| 27 | South Carolina | 4,287 | 0.74 | 279 | 428 | 864 | 202 |
| 28 | Kentucky | 4,011 | 0.69 | 277 | 399 | 666 | 221 |
| 29 | Oklahoma | 3,932 | 0.68 | 255 | 325 | 1,128 | 290 |
| 30 | Alabama | 3,351 | 0.58 | 267 | 329 | 503 | 175 |
| 31 | New Mexico | 3,333 | 0.58 | 294 | 252 | 1,534 | 215 |
| 32 | Louisiana | 3,173 | 0.55 | 182 | 378 | 437 | 246 |
| 33 | Utah | 3,131 | 0.54 | 290 | 114 | 688 | 194 |
| 34 | Connecticut | 2,905 | 0.5 | 306 | 199 | 177 | 148 |
| 35 | Iowa | 2,647 | 0.46 | 245 | 154 | 368 | 141 |
| 36 | Puerto Rico | 2,451 | 62 | 88 | 668 | 46 | |
| 37 | Kansas | 2,449 | 0.42 | 223 | 203 | 380 | 153 |
| 38 | Nebraska | 2,404 | 0.42 | 202 | 153 | 463 | 149 |
| 39 | Arkansas | 2,366 | 0.41 | 101 | 188 | 514 | 262 |
| 40 | Idaho | 2,315 | 0.4 | 276 | 178 | 364 | 90 |
| 41 | Maine | 2,097 | 0.36 | 260 | 103 | 248 | 139 |
| 42 | Alaska | 1,949 | 0.34 | 160 | 94 | 357 | 188 |
| 43 | New Hampshire | 1,675 | 0.29 | 219 | 116 | 446 | 65 |
| 44 | Montana | 1,545 | 0.27 | 167 | 165 | 223 | 79 |
| 45 | West Virginia | 1,341 | 0.23 | 58 | 104 | 174 | 112 |
| 46 | Delaware | 1,165 | 0.2 | 136 | 78 | 267 | 43 |
| 47 | Vermont | 1,110 | 0.19 | 124 | 71 | 185 | 99 |
| 48 | Mississippi | 1,107 | 0.19 | 76 | 68 | 146 | 51 |
| 49 | Rhode Island | 1,104 | 0.19 | 121 | 92 | 226 | 23 |
| 50 | South Dakota | 1,058 | 0.18 | 93 | 43 | 162 | 67 |
| 51 | Guam | 790 | 92 | 21 | 84 | 15 | |
| 52 | Wyoming | 612 | 0.11 | 50 | 51 | 81 | 91 |
| 53 | North Dakota | 541 | 0.09 | 54 | 49 | 92 | 35 |
| 54 | Virgin Islands | 304 | 0 | 13 | 105 | 6 |
Total Number of Homeless Students by State
| Rank | State | Total Number of Homeless Students | Total Number of Unaccompanied Homeless Students | Nighttime Residence: Unsheltered | Nighttime Residence: Shelters | Nighttime Residence: Hotels/motels | Nighttime Residence: Doubled up |
| 1 | California | 271,528 | 7,633 | 11,021 | 19,758 | 14,386 | 226,363 |
| 2 | New York | 148,485 | 10,643 | 5,460 | 40,822 | 2,989 | 99,034 |
| 3 | Texas | 114,055 | 17,193 | 5,823 | 10,952 | 8,159 | 89,121 |
| 4 | Florida | 91,068 | 7,061 | 6,717 | 7,606 | 11,004 | 65,741 |
| 5 | Illinois | 54,237 | 5,026 | 337 | 5,093 | 2,217 | 42,647 |
| 6 | Washington | 39,972 | 6,392 | 2,830 | 4,785 | 2,486 | 29,871 |
| 7 | Georgia | 38,891 | 2,536 | 642 | 2,675 | 7,632 | 27,942 |
| 8 | Michigan | 34,853 | 4,763 | 675 | 4,922 | 2,502 | 26,754 |
| 9 | North Carolina | 34,765 | 3,321 | 1,211 | 3,334 | 4,986 | 25,234 |
| 10 | Missouri | 34,029 | 4,241 | 643 | 2,396 | 1,921 | 26,069 |
| 11 | Ohio | 32,780 | 2,429 | 359 | 4,800 | 1,731 | 25,890 |
| 12 | Pennsylvania | 31,822 | 5,789 | 526 | 7,281 | 2,428 | 21,587 |
| 13 | Massachusetts | 24,658 | 1,389 | 206 | 7,502 | 1,620 | 15,330 |
| 14 | Kentucky | 24,177 | 2,602 | 2,664 | 2,518 | 966 | 18,029 |
| 15 | Oregon | 23,765 | 3,699 | 2,654 | 1,824 | 1,094 | 18,193 |
| 16 | Oklahoma | 23,372 | 1,137 | 774 | 1,668 | 615 | 20,315 |
| 17 | Colorado | 21,560 | 2,646 | 1,043 | 2,455 | 2,179 | 15,889 |
| 18 | Arizona | 21,062 | 1,894 | 602 | 2,462 | 1,975 | 13,307 |
| 19 | Virginia | 20,443 | 2,672 | 185 | 1,937 | 3,262 | 15,059 |
| 20 | Tennessee | 19,747 | 1,354 | 585 | 1,367 | 1,903 | 15,892 |
| 21 | Nebraska | 18,647 | 1,050 | 150 | 1,082 | 366 | 2,777 |
| 22 | Wisconsin | 18,394 | 2,322 | 308 | 1,971 | 1,485 | 14,630 |
| 23 | Indiana | 18,252 | 1,110 | 257 | 2,268 | 1,573 | 14,154 |
| 24 | Louisiana | 17,330 | 2,942 | 373 | 1,399 | 715 | 14,843 |
| 25 | Minnesota | 17,071 | 3,285 | 430 | 3,690 | 1,425 | 11,526 |
| 26 | Maryland | 16,202 | 1,874 | 165 | 2,062 | 1,438 | 12,537 |
| 27 | Alabama | 16,118 | 679 | 375 | 852 | 852 | 14,207 |
| 28 | New Jersey | 13,929 | 2,626 | 42 | 1,754 | 1,538 | 10,595 |
| 29 | Arkansas | 13,910 | 777 | 222 | 604 | 543 | 12,541 |
| 30 | Utah | 13,745 | 2,580 | 698 | 913 | 479 | 11,655 |
| 31 | South Carolina | 12,545 | 1,020 | 2,098 | 960 | 1,864 | 7,621 |
| 32 | New Mexico | 11,574 | 2,051 | 1,244 | 1,150 | 604 | 8,555 |
| 33 | West Virginia | 10,522 | 951 | 279 | 834 | 259 | 9,150 |
| 34 | Kansas | 8,369 | 1,032 | 125 | 772 | 507 | 6,965 |
| 35 | Idaho | 7,810 | 1,056 | 436 | 534 | 577 | 6,263 |
| 36 | Iowa | 7,295 | 1,101 | 123 | 1,397 | 607 | 5,168 |
| 37 | Mississippi | 7,003 | 332 | 129 | 249 | 263 | 6,362 |
| 38 | District of Columbia | 6,858 | 265 | 108 | 1,427 | 318 | 4,746 |
| 39 | Connecticut | 4,722 | 224 | 39 | 837 | 640 | 3,206 |
| 40 | Puerto Rico | 4,717 | no data | 439 | 1,016 | 7 | 3,255 |
| 41 | Montana | 4,216 | 720 | 398 | 331 | 375 | 3,111 |
| 42 | New Hampshire | 3,971 | 341 | 175 | 450 | 377 | 2,969 |
| 43 | Hawaii | 3,604 | 30 | 297 | 777 | 19 | 2,510 |
| 44 | Alaska | 3,576 | 811 | 333 | 646 | 186 | 2,411 |
| 45 | Deleware | 3,547 | 412 | 20 | 203 | 577 | 2,747 |
| 46 | Maine | 2,552 | 428 | 105 | 535 | 284 | 1,628 |
| 47 | North Dakota | 2,530 | 285 | 171 | 418 | 165 | 1,776 |
| 48 | South Dakota | 1,907 | 98 | 61 | 338 | 278 | 1,230 |
| 49 | Wyoming | 1,764 | 331 | 53 | 377 | 128 | 1,206 |
| 50 | Rhode Island | 1,475 | 12 | 17 | 229 | 193 | 1,036 |
| 51 | Vermont | 1,008 | 89 | 51 | 157 | 200 | 600 |
| 52 | Guam | no data | no data | no data | no data | no data | no data |
| 53 | Nevada | no data | no data | no data | no data | no data | no data |
| 54 | Virgin Islands | no data | no data | no data | no data | no data | no data |
Homelessness Statistics by State Map(s)
Homelessness Statistics by State:
Comprehensive USICH Map of U.S. Homelessness
The Homelessness Statistics by State Map was created by the United States Interagency Council on Homelessness (USICH) and can be used to see homelessness data all across the U.S. Using data reported by public schools and data from the U.S. Department of Housing and Urban Development (HUD), the map effectively portrays the state of homelessness in the United States using a color-coded and easy-to-use selection map. Click on any given state and see both total homeless populations and the total number of homeless students. Each category has sub-categories, including but not limited to number of homeless veterans, unaccompanied homeless students, and unaccompanied young adults (those between the ages of 18 and 24).
Education, Housing, and Head Start Contacts
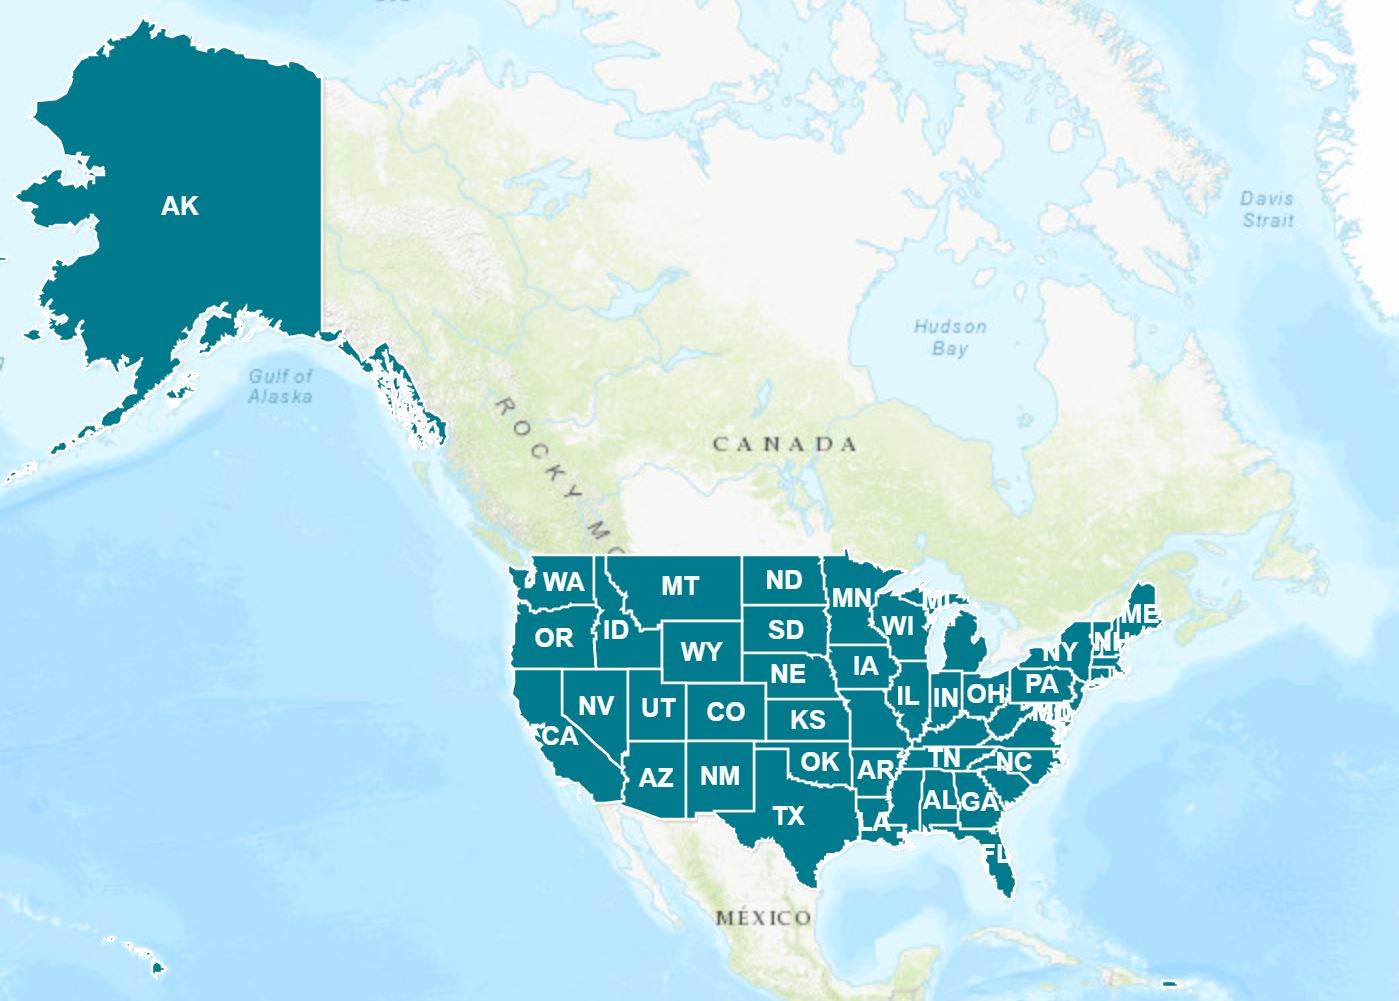
The Education, Housing, and Head Start Contacts map can be used to find information on Head Start State Collaboration Offices, homeless education state coordinators, and homelessness liaisons. Click on any state to see a state homeless profile with clickable resource links.
Tool created by the U.S. Department of Health and Human Services Early Childhood Learning and Knowledge Center (Head Start).
Poverty Rates in Your Community
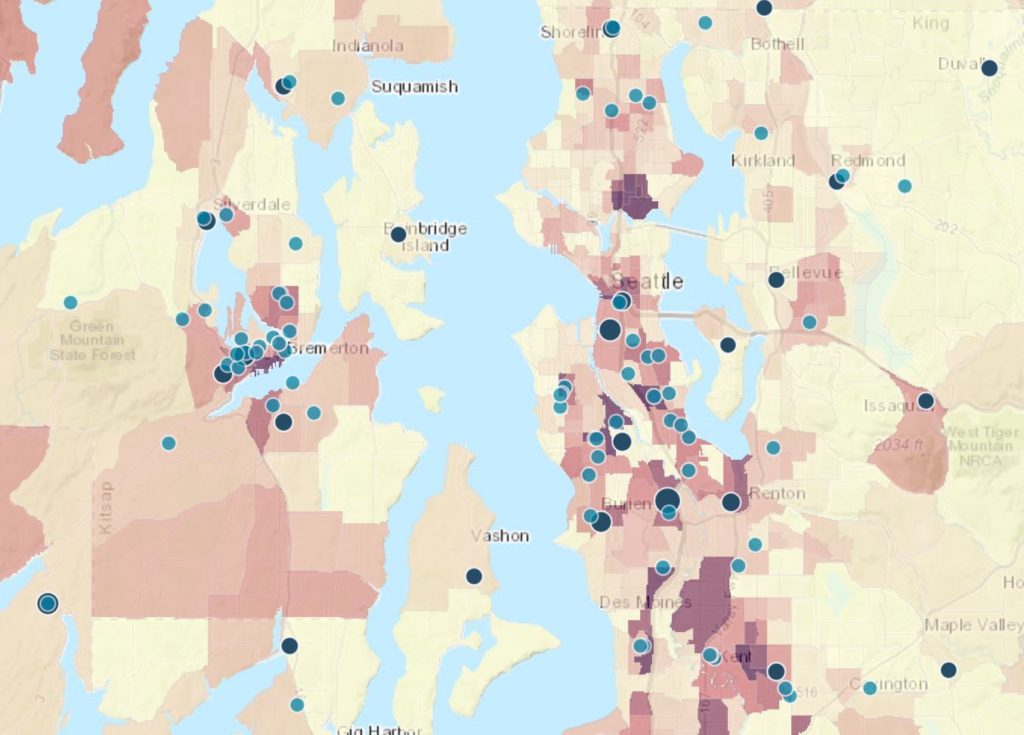
Use the Poverty Rates in Your Community tool to see poverty rates in your community alongside Head Start locations. The tool displays poverty rates at the census tract level. the county level, and the state level.
Tool created by the U.S. Department of Health and Human Services Early Childhood Learning and Knowledge Center (Head Start).
National Service Providers
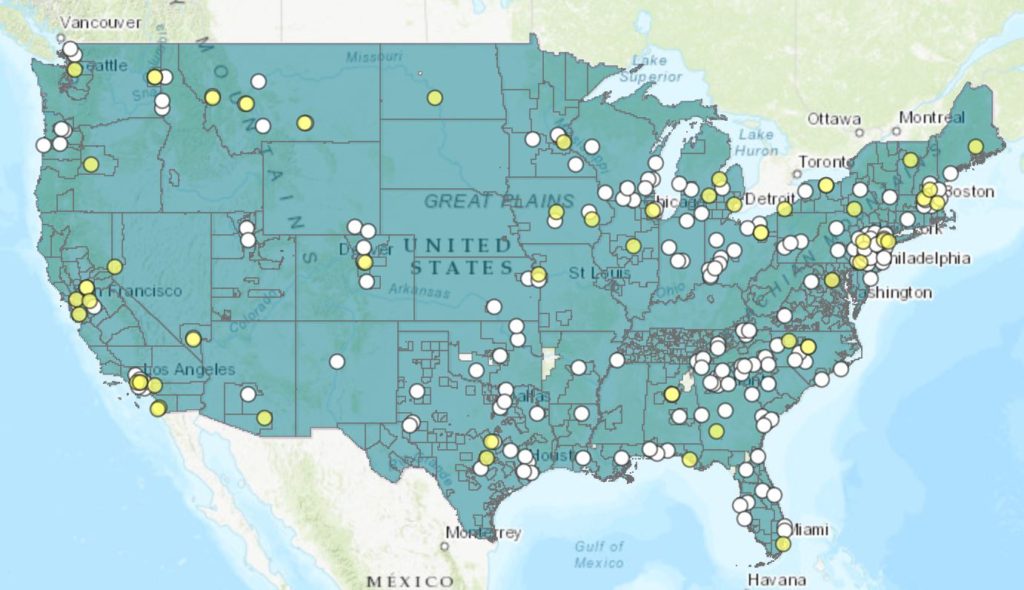
Use the National Service Providers map to find organizations that assist families experiencing homelessness. The map includes maternity group homes, family promise affiliates, and continuum of care grantee areas.
Tool created by the U.S. Department of Health and Human Services Early Childhood Learning and Knowledge Center (Head Start).
State of Homelessness
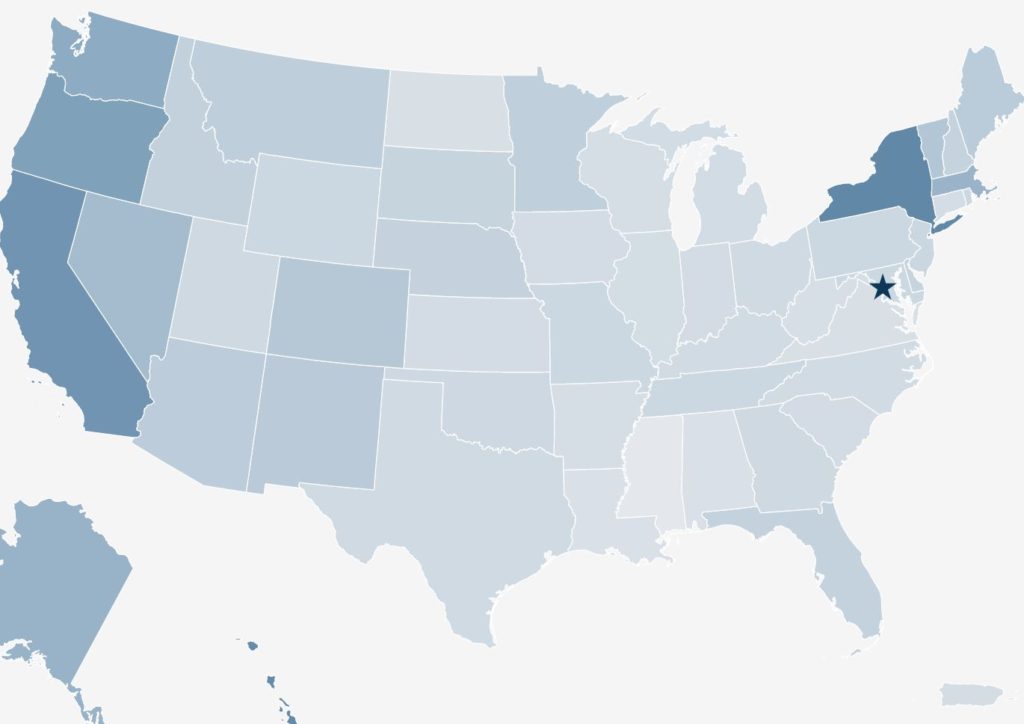
Use the State of Homelessness map to see a comprehensive assessment of homelessness in America. The assessment includes a basic overview, trends in homelessness, locating homelessness, homelessness assistance, indicators at risk, and sources and methodology. The map also includes state and Continuum of Care (CoC) profiles.
Tool created by the National Alliance to End Homelessness.
