Obesity continues to affect every state within the US, and despite our best attempts to tackle the issue, over 32 percent of men and 34 percent of women are considered obese by BMI (Body Mass Index) standards. And although we have several means of collecting the data — to include the Center of Disease Control (CDC) Behavioral Risk Factor Surveillance System (BRFSS) — rarely does the data point us to one, singular causation.
However, there are several health tools that can be used to examine the issue, and some, like the Prevalence and Trends Data tool (as we’ve used below), can be used to effectively visualize and analyze adult obesity for any state and/or territory in the United States.
By understanding obesity, federal agencies, non-profits, and other organizations can forecast future trends, identify socioeconomic needs, reevaluate programs and tax policies, prioritize financial assistance, and effectively measure programs that have a direct effect on overall health.
Use the data and interactive tool(s) below to explore the most obese states in the U.S. Compare the rates below, see why some states are higher than others, and understand the difference between obesity in men and women. Pair the data with other interactive demographic and social tools to explore the issue further.
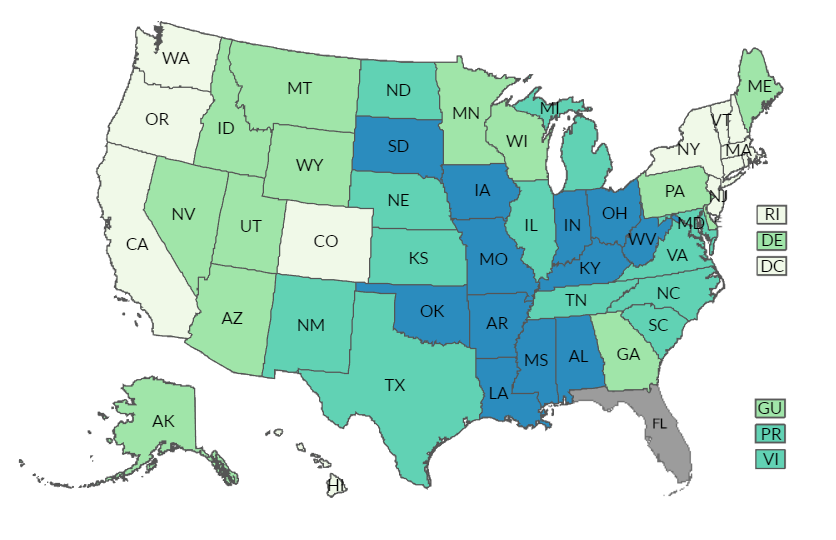
Most Obese States (All States, DC, and Territories)
| Rank | State | Obese (BMI 30.0 – 99.8) | Overweight (BMI 25.0-29.9) | Normal Weight (BMI 18.5-24.9) | Underweight (BMI 12.0-18.4) |
|---|---|---|---|---|---|
| 1 | West Virginia | 40.7% | 32.1% | 25.6% | 1.6% |
| 2 | Alabama | 40.4% | 31.0% | 26.9% | 1.8% |
| 3 | Kentucky | 40.3% | 31.3% | 25.9% | 2.5% |
| 4 | Oklahoma | 39.6% | 32.1% | 26.4% | 1.9% |
| 5 | Mississippi | 39.2% | 33.1% | 25.8% | 1.9% |
| 6 | Arkansas | 38.9% | 31.3% | 27.9% | 1.9% |
| 7 | South Dakota | 38.6% | 33.2% | 27.0% | 1.2% |
| 8 | Louisiana | 38.5% | 32.1% | 27.4% | 2.0% |
| 9 | Ohio | 37.5% | 32.9% | 28.1% | 1.5% |
| 10 | Missouri | 37.4% | 31.3% | 29.9% | 1.4% |
| 11 | Iowa | 36.3% | 33.9% | 28.1% | 1.7% |
| 12 | Indiana | 36.2% | 32.9% | 29.1% | 1.8% |
| 13 | Kansas | 36.1% | 34.0% | 28.4% | 1.5% |
| 14 | South Carolina | 36.0% | 34.1% | 28.0% | 1.9% |
| 15 | North Carolina | 35.9% | 32.3% | 30.4% | 1.4% |
| 16 | Texas | 35.9% | 33.5% | 28.7% | 1.9% |
| 17 | Puerto Rico | 35.8% | 35.9% | 26.7% | 1.6% |
| 18 | Nebraska | 35.7% | 34.7% | 28.1% | 1.5% |
| 19 | New Mexico | 35.1% | 34.9% | 28.0% | 2.0% |
| 20 | North Dakota | 35.1% | 34.6% | 28.5% | 1.9% |
| 21 | Tennessee | 35.1% | 35.8% | 26.8% | 2.2% |
| 22 | Virgin Islands | 35.1% | 29.8% | 32.0% | * |
| 23 | Michigan | 34.2% | 33.5% | 30.0% | 2.3% |
| 24 | Maryland | 34.1% | 33.5% | 30.8% | 1.6% |
| 25 | Illinois | 33.9% | 33.8% | 30.6% | 1.7% |
| 26 | Georgia | 33.8% | 33.8% | 30.4% | 2% |
| 27 | Virginia | 33.8% | 33.5% | 30.6% | 2.1% |
| 28 | Delaware | 33.5% | 33.9% | 30.6% | 2.1% |
| 29 | Alaska | 33.4% | 34.1% | 31.2% | 1.3% |
| 30 | Wisconsin | 33.3% | 34.1% | 30.7% | 2.0% |
| 31 | Pennsylvania | 32.9% | 31.9% | 33.8% | 1.3% |
| 32 | Guam | 32.4% | 31.8% | 33.5% | 2.4% |
| 33 | Minnesota | 32.2% | 34.3% | 31.9% | 1.7% |
| 34 | Wyoming | 32.2% | 36.9% | 29.5% | 1.5% |
| 35 | Maine | 31.8% | 32.8% | 33.4% | 2.1% |
| 36 | Idaho | 31.7% | 35.6% | 31.1% | 1.7% |
| 37 | Montana | 31.6% | 34.4% | 32.2% | 1.8% |
| 38 | Nevada | 31.5% | 35.4% | 31.1% | 2.0% |
| 39 | Arizona | 31.4% | 36.3% | 30.1% | 2.2% |
| 40 | Utah | 31.1% | 33.4% | 33.5% | 2.0% |
| 41 | Oregon | 30.6% | 34.0% | 33.5% | 1.9% |
| 42 | New Hampshire | 30.5% | 34.4% | 32.5% | 2.6% |
| 43 | Connecticut | 30.3% | 34.5% | 32.2% | 3.0% |
| 44 | Rhode Island | 30.3% | 35.3% | 32.5% | 1.9% |
| 45 | New York | 28.8% | 34.1% | 34.7% | 2.4% |
| 46 | Vermont | 28.8% | 31.1% | 37.4% | 2.6% |
| 47 | Washington | 28.7% | 34.9% | 34.6% | 1.8% |
| 48 | New Jersey | 28.0% | 36.4% | 33.8% | 1.7% |
| 49 | California | 27.6% | 36.0% | 34.1% | 2.2% |
| 50 | Massachusetts | 27.0% | 33.0% | 37.7% | 2.3% |
| 51 | Hawaii | 25.9% | 34.8% | 37.0% | 2.3% |
| 52 | District of Co | 25.1% | 30.9% | 42.6% | 1.4% |
| 53 | Colorado | 25.0% | 35.1% | 37.5% | 2.3% |
| Average | 33.5% | 33.7% | 30.9% | 1.9% |
Obesity by State Facts
- Obesity is a national epidemic which causes a low quality of life, mental health issues, and higher medical costs.
- If your BMI is greater or equal to 30 then you are considered obese.
- Because obese individuals incur higher medical costs, obesity places a significant financial burden on the US medical care system.
- Non-Hispanic black women and Hispanics have the highest rate of obesity.
- The top 5 most obese states include West Virginia, Alabama, Kentucky, Oklahoma, Mississippi (but keep in mind there is a margin of error).
- Medical complication of obesity include sleep apnea, lung disease, liver disease, gallstones, cancer, stroke, heart disease, diabetes, pancreatitis, abnormal periods, infertility, arthritis, inflamed veins (sometimes with blood clots), and gout.
- While obesity is directly caused by eating too much and a lack of physical activity, there are multiple factors that affect obesity. Those factors include: (1) societal and community changes, (2) lack of access to inexpensive, healthy food, (3) food deserts, (4) too much sugar in our diets, (5) difference in regional diets, (6) frequent advertising and consumption of foods that are high in sugar, fat, and salt, (7) lack of parks or recreational facilities nearby, (8) car dependency instead of walking, and (9) lack of physical education in schools.
Most Obese States by Gender
| Location | Male Obesity | Female Obesity |
|---|---|---|
| Alabama | 38% | 41.6% |
| Alaska | 32.3% | 34.9% |
| Arizona | 31.1% | 31.6% |
| Arkansas | 38.7% | 38.6% |
| California | 26.5% | 28.7% |
| Colorado | 24.5% | 25.8% |
| Connecticut | 30.1% | 30.7% |
| Delaware | 31.7% | 36.1% |
| District of Columbia | 20.7% | 28.6% |
| Georgia | 32% | 35.8% |
| Hawaii | 28.4% | 21.4% |
| Idaho | 31.4% | 31.8% |
| Illinois | 33.6% | 34.7% |
| Indiana | 34.4% | 38.2% |
| Iowa | 36.3% | 36.5% |
| Kansas | 35.5% | 36.6% |
| Kentucky | 39.8% | 40.9% |
| Louisiana | 36% | 41.2% |
| Maine | 31.6% | 32.2% |
| Maryland | 33.3% | 35.4% |
| Massachusetts | 27.7% | 27% |
| Michigan | 33.9% | 34.9% |
| Minnesota | 33.6% | 31.1% |
| Mississippi | 36.7% | 41.4% |
| Missouri | 37.8% | 36.6% |
| Montana | 31.7% | 31.9% |
| Nebraska | 36.8% | 35% |
| Nevada | 33.1% | 29.4% |
| New Hampshire | 33.3% | 27.8% |
| New Jersey | 28.8% | 27.5% |
| New Mexico | 33.5% | 35.6% |
| New York | 28.4% | 29.8% |
| North Carolina | 34.1% | 37.9% |
| North Dakota | 37.1% | 33.1% |
| Ohio | 36.4% | 39.1% |
| Oklahoma | 39.8% | 39% |
| Oregon | 29.7% | 31.1% |
| Pennsylvania | 34% | 32.6% |
| Rhode Island | 30.9% | 29.2% |
| South Carolina | 33.8% | 38.3% |
| South Dakota | 39.7% | 37% |
| Tennessee | 32.8% | 37.1% |
| Texas | 35.6% | 36.6% |
| Utah | 30.5% | 31.4% |
| Vermont | 29% | 29% |
| Virginia | 33.6% | 34.9% |
| Washington | 28.3% | 29.3% |
| West Virginia | 39.4% | 41.8% |
| Wisconsin | 33.3% | 34.5% |
| Wyoming | 32.4% | 31.5% |
| Guam | 36% | 30.7% |
| Puerto Rico | 34.3% | 37.5% |
| Virgin Islands | 25.7% | 44.5% |
| Average Obesity | 32.97 (men) | 34.06 (women) |
What Can be Done to Tackle Obesity?
- Individuals, states, and the U.S. government can promote healthier eating.
- Individuals can replace sugary drinks with water.
- Individuals can limit screen time and replace it with physical activity.
- Individuals, states, and the U.S. government can promote change within communities through community initiatives.
- Individuals can work with local, state, and federal initiatives to reduce obesity.
- Individuals, states, and the U.S. government can create additional recreational opportunities.
- Communities can advocate for quality physical education.
- Communities can support local, healthy food initiatives and reduce healthy food barriers.
- Individuals, states, and the U.S. government can reduce car dependency and promote/build infrastructure that supports cyclist and walkers.
Obesity Maps and Tools
CDC Data, Trends, and Maps Tool: An interactive database that provides users with national and state-level data about obesity/weight, breastfeeding, physical activity, sugar drinks, fruits and vegetables, and television watching. Click here to use the tool.
BRFSS Prevalence and Trends Data Tool: An interactive database that provides users with national and state-level data about obesity/weight, alcohol consumption, prostate cancer, oral health, tobacco use, and more. Click here to use the tool. (This tool was used for this article to calculate the most obese states in the US)
Millennial Cities
Want free articles, news, tools, and information? Subscribe below and we’ll add you to the list!