For most people, airline rankings are subjective; they really depend on your beliefs, your personal experience, and your individual preferences.
However, when looking at airlines through a data lens, there are some ways of measuring the best and worst airlines in the US.
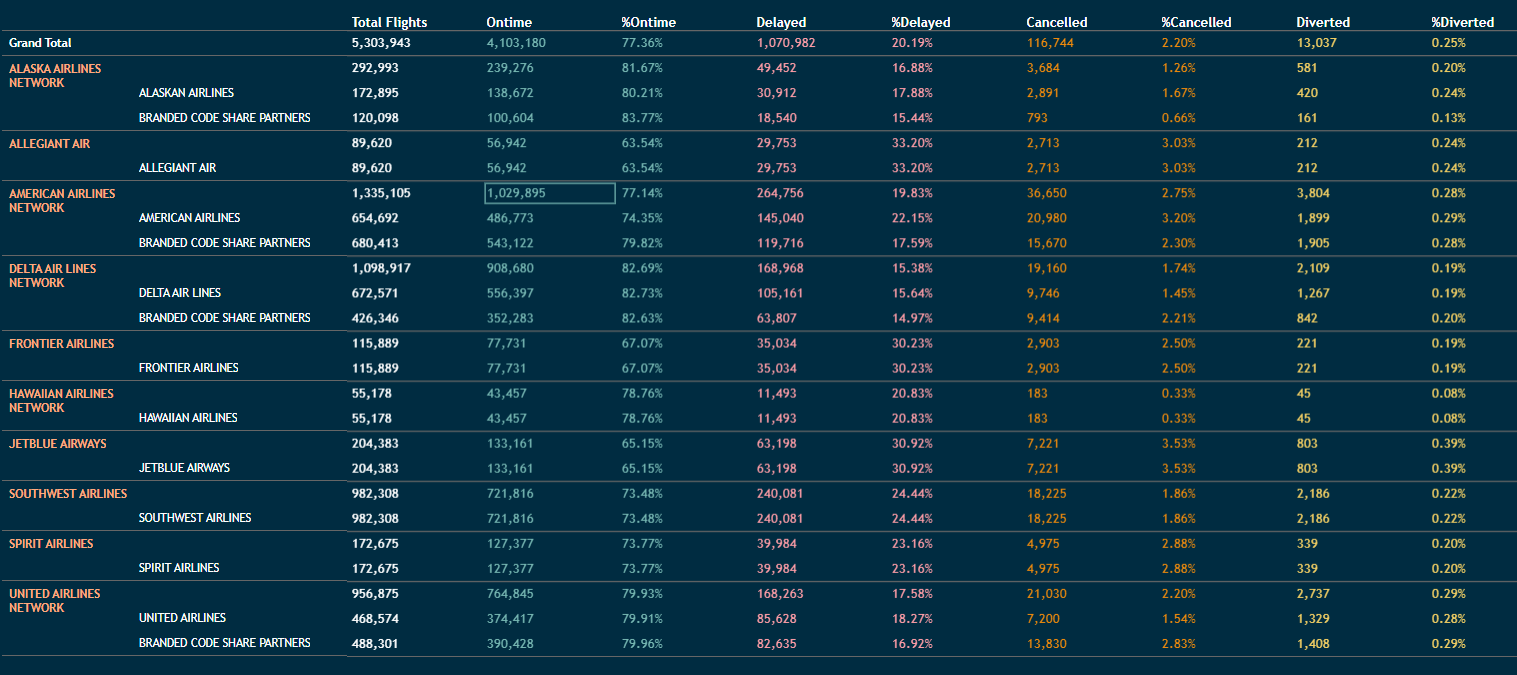
One such way is to use publicly available tools — such as the Bureau of Transportation Statistics Airline Arrival Performance Dashboard — that can be used to effectively visualize and analyze flight data for any airline in the United States.
By leveraging airline data, federal agencies can track and receive credible information, understand transportation’s role in society, and measure the consequences of transportation on the economy and environment.
For purposes of this article, we’ll look at 10 major air carriers — Alaska Airlines, Allegiant Air, American Airlines, Delta Airlines, Frontier Airlines, Hawaiian Airlines, JetBlue Airways, Southwest Airlines, Spirit Airlines, and United Airlines — and rank them by flight on time/delay, baggage lost, passengers denied confirmed space, and consumer complaints.
The Best Airlines (By Flight On Time)
| Rank | Carrier | Total Flights (2022) | On Time | Delayed | Canceled | Diverted |
|---|---|---|---|---|---|---|
| 1 | Delta Airlines | 672,571 | 82.73% | 15.64% | 1.45% | 0.19% |
| 2 | Alaskan Airlines | 172,895 | 80.21% | 17.88% | 1.67% | 0.24% |
| 3 | United Airlines | 468,574 | 79.91% | 18.27% | 1.54% | 0.28% |
| 4 | Hawaiian Airlines | 55,178 | 78.76% | 20.83% | 0.33% | 0.08% |
| 5 | American Airlines | 654,692 | 74.35% | 22.15% | 3.20% | 0.29% |
| 6 | Spirit Airlines | 172,675 | 73.77% | 23.16% | 2.88% | 0.20% |
| 7 | Southwest Airlines | 982,308 | 73.48% | 24.44% | 1.86% | 0.22% |
| 8 | Frontier Airlines | 115,889 | 67.07% | 30.23% | 2.50% | 0.19% |
| 9 | JetBlue Airways | 204,383 | 65.15% | 30.92% | 3.53% | 0.39% |
| 10 | Allegiant Air | 89,620 | 63.54% | 33.20% | 3.03% | 0.24% |
The Worst Airlines (By Flight Delay)
| Rank | Airline | Total Flights (2022) | Delayed | On Time | Canceled | Diverted |
|---|---|---|---|---|---|---|
| 1 | Allegiant Air | 89,620 | 33.20% | 63.54% | 3.03% | 0.24% |
| 2 | JetBlue Airways | 204,383 | 30.92% | 65.15% | 3.53% | 0.39% |
| 3 | Frontier Airlines | 115,889 | 30.23% | 67.07% | 2.50% | 0.19% |
| 4 | Southwest Airlines | 982,308 | 24.44% | 73.48% | 1.86% | 0.22% |
| 5 | Spirit Airlines | 172,675 | 23.16% | 73.77% | 2.88% | 0.20% |
| 6 | American Airlines | 654,692 | 22.15% | 74.35% | 3.20% | 0.29% |
| 7 | Hawaiian Airlines | 55,178 | 20.83% | 78.76% | 0.33% | 0.08% |
| 8 | United Airlines | 468,574 | 18.27% | 79.91% | 1.54% | 0.28% |
| 9 | Alaskan Airlines | 172,895 | 17.88% | 80.21% | 1.67% | 0.24% |
| 10 | Delta Airlines | 672,571 | 15.64% | 82.73% | 1.45% | 0.19% |
Worst Airlines (By Baggage Lost)
| Rank | Airline | Mishandled Bags per 1 Million Bags Enplaned | Total Mishandled Bags (2021) | Enplaned Bags | Mishandled Bags (As Percent) |
|---|---|---|---|---|---|
| 1 | American Airlines | 6,680 | 236,711 | 35,433,340 | 0.67% |
| 2 | JetBlue Airways | 4,725 | 52,452 | 11,101,136 | 0.47% |
| 3 | Alaska Air | 4,492 | 27,669 | 6,159,207 | 0.45% |
| 4 | United Airlines | 4,344 | 87,182 | 20,069,210 | 0.43% |
| 5 | Spirit Airlines | 4,215 | 40,720 | 9,659,748 | 0.42% |
| 6 | Southwest Airlines | 3,665 | 325,940 | 88,943,087 | 0.37% |
| 7 | Delta Airlines | 3,615 | 68,638 | 18,988,360 | 0.36% |
| 8 | Frontier Airlines | 2,957 | 22,715 | 7,680,657 | 0.30% |
| 9 | Hawaiian Airlines | 2,188 | 8,316 | 3,801,593 | 0.22% |
| 10 | Allegiant Air | 1,666 | 8,067 | 4,842,544 | 0.17% |
Worst Airlines (Passengers Denied Confirmed Space)
| Rank | Airline | Number of Passengers Denied per 1 Million Boardings | Total Denied Boarding Involuntarily | Total Boardings (2021) |
|---|---|---|---|---|
| 1 | Frontier Airlines | 95 | 2,063 | 21,780,718 |
| 2 | Southwest Airlines | 33 | 4,017 | 122,436,514 |
| 3 | American Airlines | 20 | 2,139 | 107,654,791 |
| 4 | Spirit Airlines | 13 | 374 | 29,158,299 |
| 5 | Alaska Airlines | 5 | 118 | 22,346,992 |
| 6 | JetBlue Airways | 2 | 59 | 26,421,052 |
| 7 | United Air Lines | 1 | 27 | 65,305,262 |
| 8 | Allegiant Airlines | 0 | 0 | 13,625,848 |
| 9 | Delta Air Lines | 0 | 0 | 97,887,032 |
| 10 | Hawaiian Airlines | 0 | 0 | 6,485,564 |
Best Airlines (By Consumer Complaints)
| Rank | Airline | Complaints (2022) | Systemwide Enplanements | Complaints per 100,000 Enplanements |
|---|---|---|---|---|
| 1 | SOUTHWEST AIRLINES | 1,552 | 116,462,836 | 1.33 |
| 2 | ALASKA AIRLINES | 540 | 23,557,281 | 2.29 |
| 3 | DELTA AIR LINES | 2,646 | 105,350,076 | 2.51 |
| 4 | HAWAIIAN AIRLINES | 231 | 7,346,723 | 3.14 |
| 5 | AMERICAN AIRLINES | 5,843 | 110,913,179 | 5.27 |
| 6 | UNITED AIRLINES | 4,438 | 81,911,759 | 5.42 |
| 7 | ALLEGIANT AIR | 1,028 | 12,891,014 | 7.97 |
| 8 | JETBLUE AIRWAYS | 2,603 | 29,122,976 | 8.94 |
| 9 | SPIRIT AIRLINES | 2,654 | 28,158,200 | 9.43 |
| 10 | FRONTIER AIRLINES | 2,818 | 18,638,822 | 15.12 |
| Total | 26,150 | 617,706,027 | 4.23 |
Worst Airlines (By Consumer Complaints)
| Rank | Airline | Complaints (2022) | Systemwide Enplanements | Complaints per 100,000 Enplanements |
|---|---|---|---|---|
| 1 | FRONTIER AIRLINES | 2,818 | 18,638,822 | 15.12 |
| 2 | SPIRIT AIRLINES | 2,654 | 28,158,200 | 9.43 |
| 3 | JETBLUE AIRWAYS | 2,603 | 29,122,976 | 8.94 |
| 4 | ALLEGIANT AIR | 1,028 | 12,891,014 | 7.97 |
| 5 | UNITED AIRLINES | 4,438 | 81,911,759 | 5.42 |
| 6 | AMERICAN AIRLINES | 5,843 | 110,913,179 | 5.27 |
| 7 | HAWAIIAN AIRLINES | 231 | 7,346,723 | 3.14 |
| 8 | DELTA AIR LINES | 2,646 | 105,350,076 | 2.51 |
| 9 | ALASKA AIRLINES | 540 | 23,557,281 | 2.29 |
| 10 | SOUTHWEST AIRLINES | 1,552 | 116,462,836 | 1.33 |
| Total | 26,150 | 617,706,027 | 4.23 |
Frequently Asked Questions (FAQ)
What years do these tables cover?
We collected and used the most recent data available from the Bureau of Transportation Statistics. Please look at the source below each table to find observed years/months.
Do the airlines listed include branded codeshare partners?
No, for purposes of this article, we looked at the 10 most popular airlines in the U.S and did not include their branded codeshare partners. If you’d like to access that data, we recommend downloading it from bts.gov.
Are there interactive tools to explore this information further?
Yes, the Bureau of Transportation Statistics has several tools that users can explore. One such tool is the Airline Arrival Performance Dashboard as seen below.
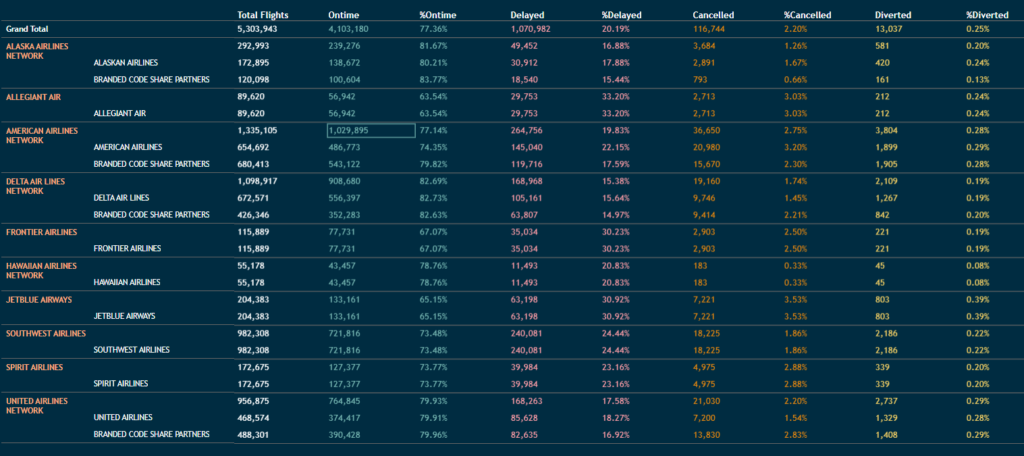
Airline Arrival Performance Dashboard
Explore the Airline Arrival Performance Dashboard to explore arrival performance by marketing carrier for major airlines within the U.S. Sort data by date, minutes, and origin/destinations.
Millennial Cities
Want free articles, news, tools, and information? Subscribe below and we’ll add you to the list!