Gerrymandering is the process of manipulating an electoral boundary to favor one political party’s interest over another.
For example, if you have a state where 30% of the population is Republican and 70% of the population is Democrat, a gerrymandered state (in this situation) would mean that Republicans control the majority of districts despite the state being far more populated with Democrats.
In today’s environment, where new census data has just been released and new maps are being drawn, it’s become increasingly important that we understand redistricting and gerrymandering and the ramifications that come with it.
So, to better understand this process, we’ve compiled a list of free, interactive gerrymandering and redistricting tools where users can observe, draw, and better understand gerrymandering.
To find additional political tools that are similar to the below interactive gerrymandering tools, explore our collection of web mapping applications, where we’ve compiled hundreds of free, interactive tools relating to climate change, social justice, housing, and more.
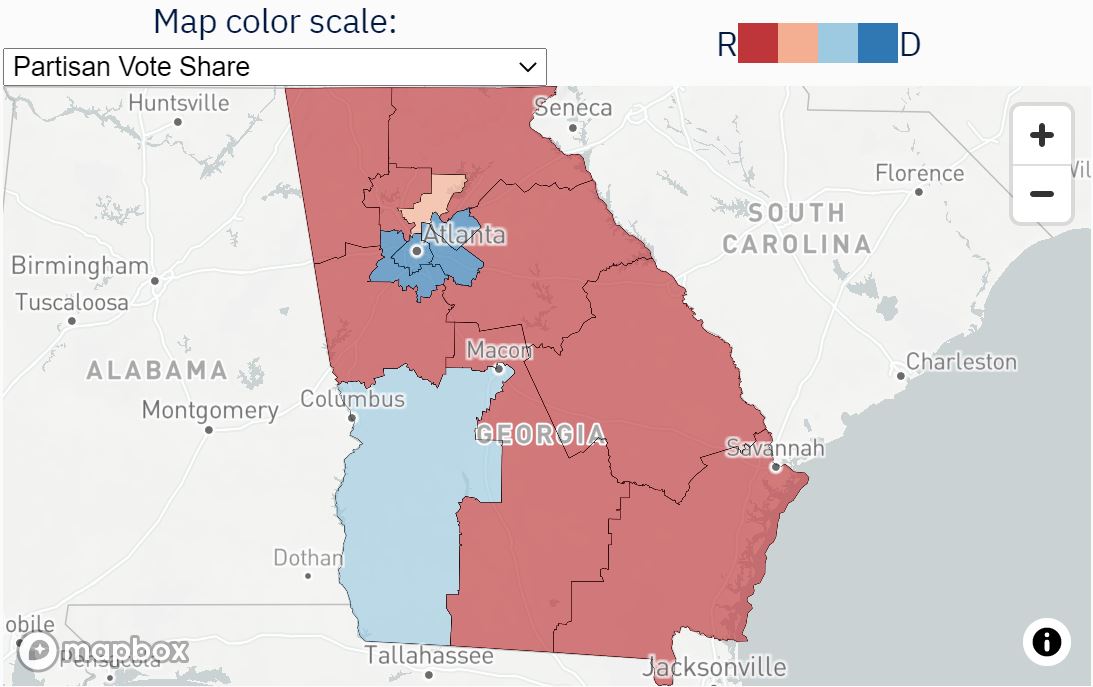
1. Redistricting Report Card
Developed by the Princeton Gerrymandering Project, this tool helps the public identify states that have gerrymandered districts by grading them with a “report card.”
Using unique analysis and a powerful algorithm, the map identifies and scores districts based on partisan fairness, geographic features, partisan composition, and minority composition.
Assigns letter grades to redistricting efforts.
For example, Georgia (as pictured) was given an overall grade of “C” which it defines as “Average for the category, could be better, but also could be worse.”
Tool created by the Princeton Gerrymandering Project and RepresentUs.
2. PlanScore
PlanScore is a way for policymakers, the general public, and advocacy groups to score old and new redistricting maps and assess whether they are fair or politically gerrymandered.
Developed by the Campaign Legal Center, a non-profit organization dedicated to a fair election process, PlanScore is a means to view and analyze both historical and new district plans across the United States.
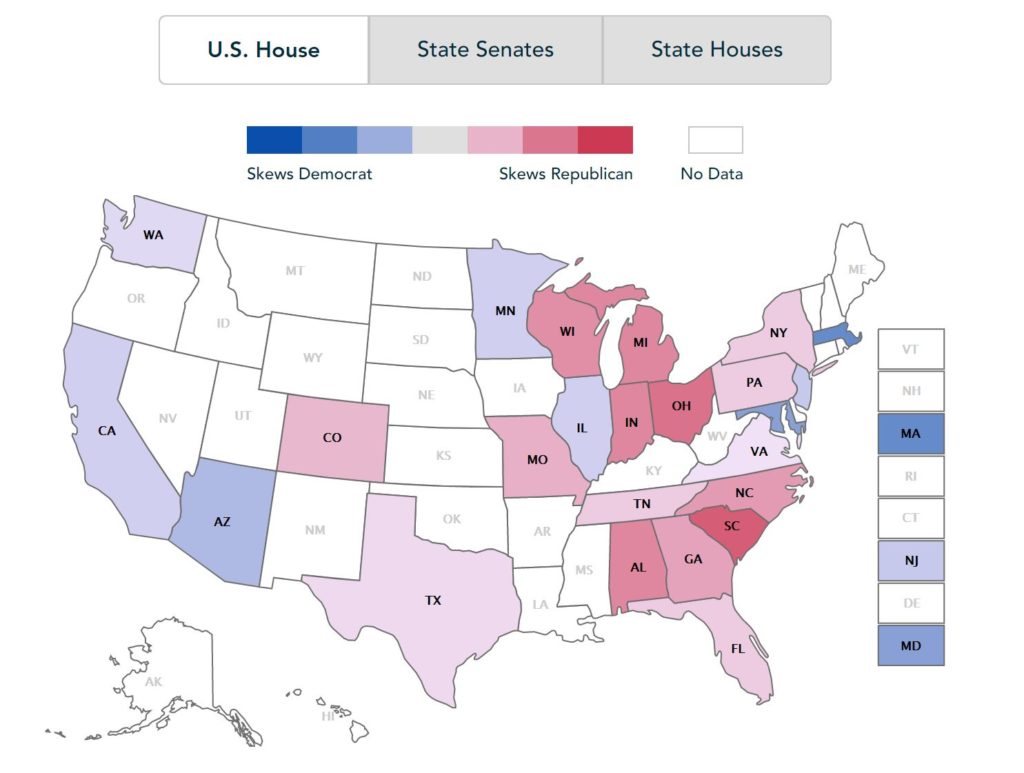
Scores U.S. House, State Senates, and State Houses on partisan gerrymandering
Uses four measures to assess and assign a partisan score for every state. Users can access historical datasets and a comprehensive library for new district plans.
Tool created by the Campaign Legal Center.
3. Gerrymandering Threat Index
The Gerrymandering Threat Index is a free and easy-to-use tool that assigns each state a “threat level.” Using 5 different levels, states are categorized as extreme, high, moderate, low, or minimal.
Developed by RepresentUs, the tool has a simple drop-down menu and map where the user can select their respective state and explore RepresentUs’ findings.
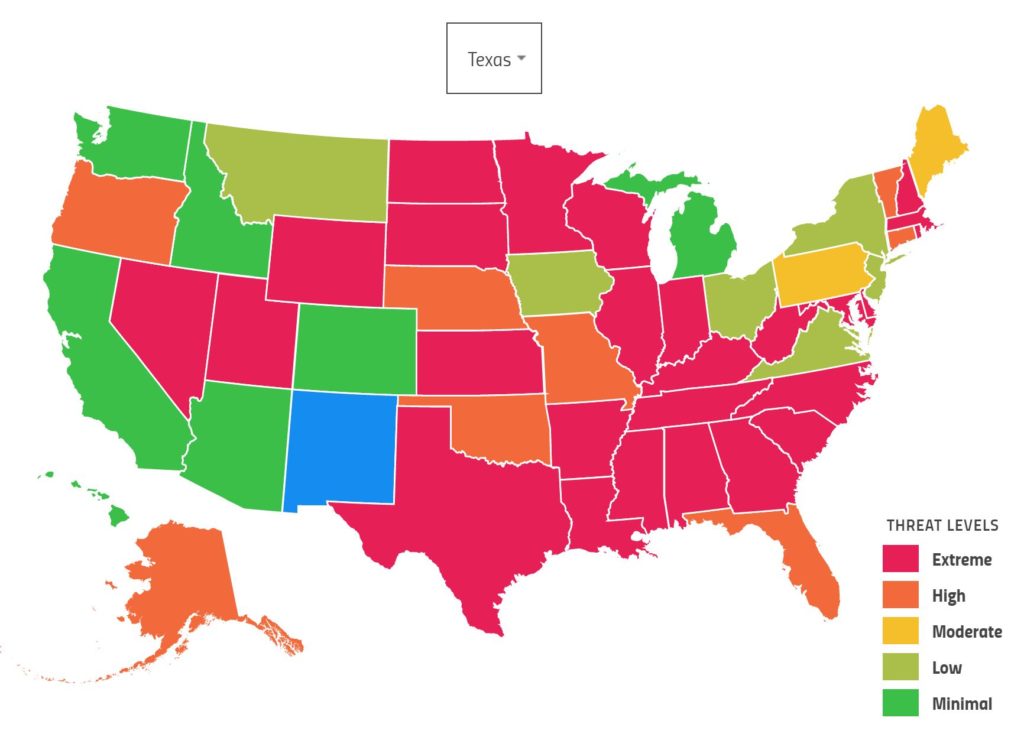
Assigns each state an overall threat level for partisan gerrymandering.
Determines threat level through 5 separate questions:
- Threat 1 – Can politicians control how election maps are drawn?
- Threat 2 – Can election maps be drawn in secret?
- Threat 3 – Can election maps be rigged for partisan gain?
- Threat 4 – Are the legal standards weak?
- Threat 5 – Are rigged election maps hard to challenge in court?
Tool created by RepresentUs
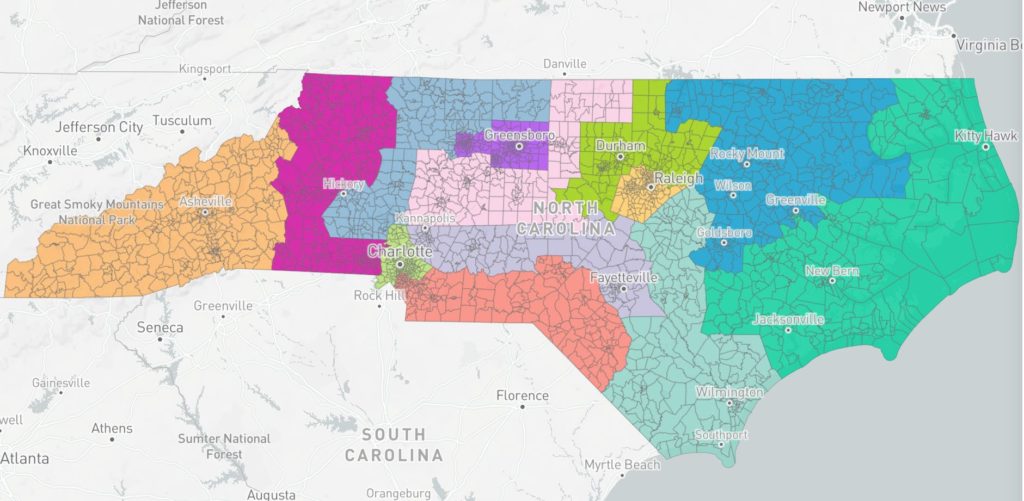
4. Dave’s Redistricting
Dave’s Redistricting Tool is a little more complicated than some of the others on this list but it has a lot of options. Made by a team of like-minded volunteers, the tool combines election data with 2010 and 2020 census data and 2019 and 2018 5-Year ACS/CVAP estimates to map out gerrymandering for each state.
Users can observe official legislative maps or modify these maps to create something on their own.
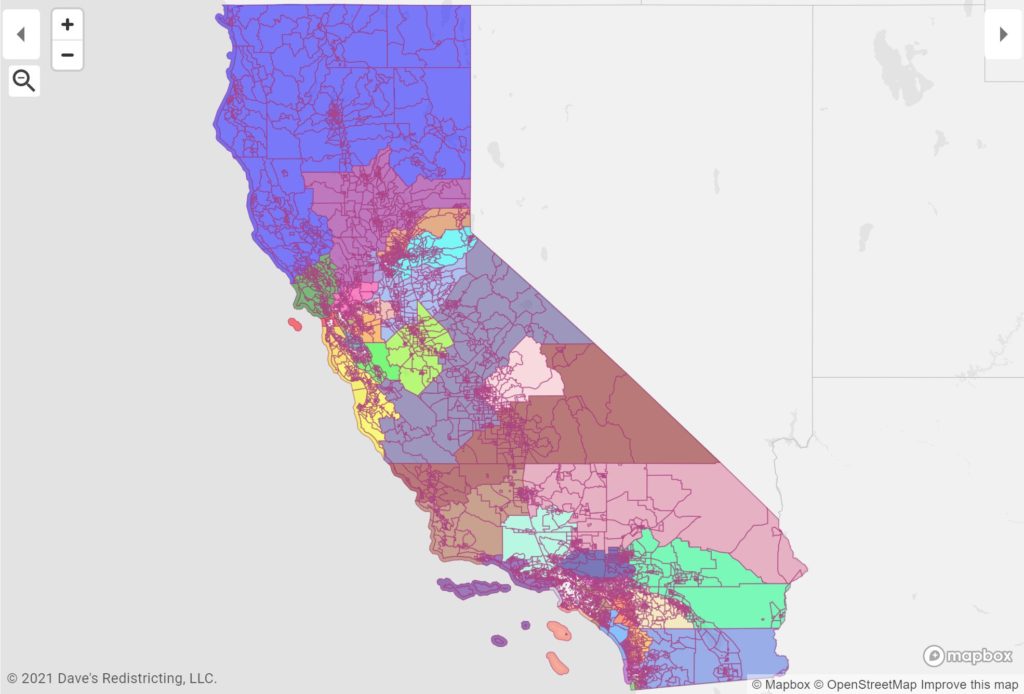
Observe, modify, or create congressional and legislative district maps.
Outlines and maps districts based on most proportional, most competitive, best minority representation, most compact, and least splitting.
Tool created and maintained by a group of volunteers.
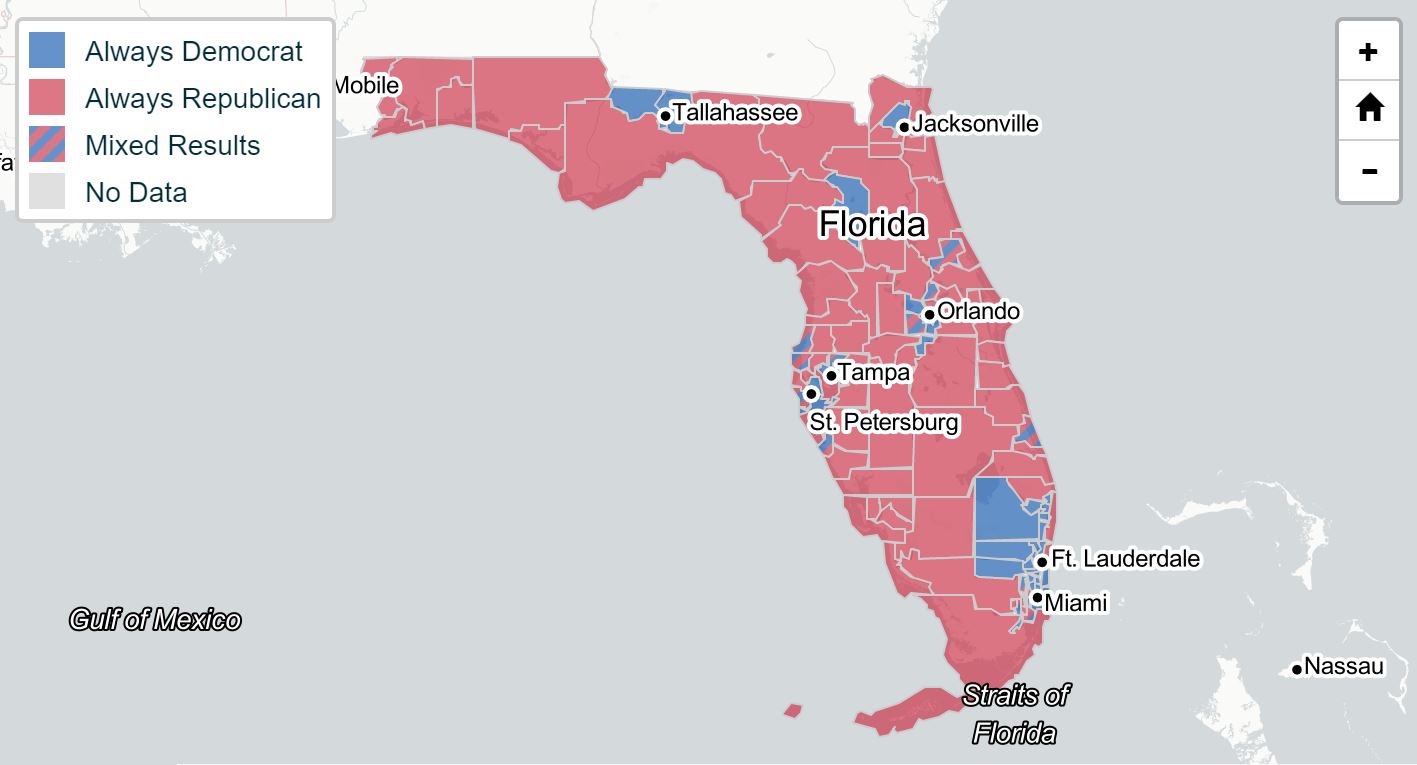
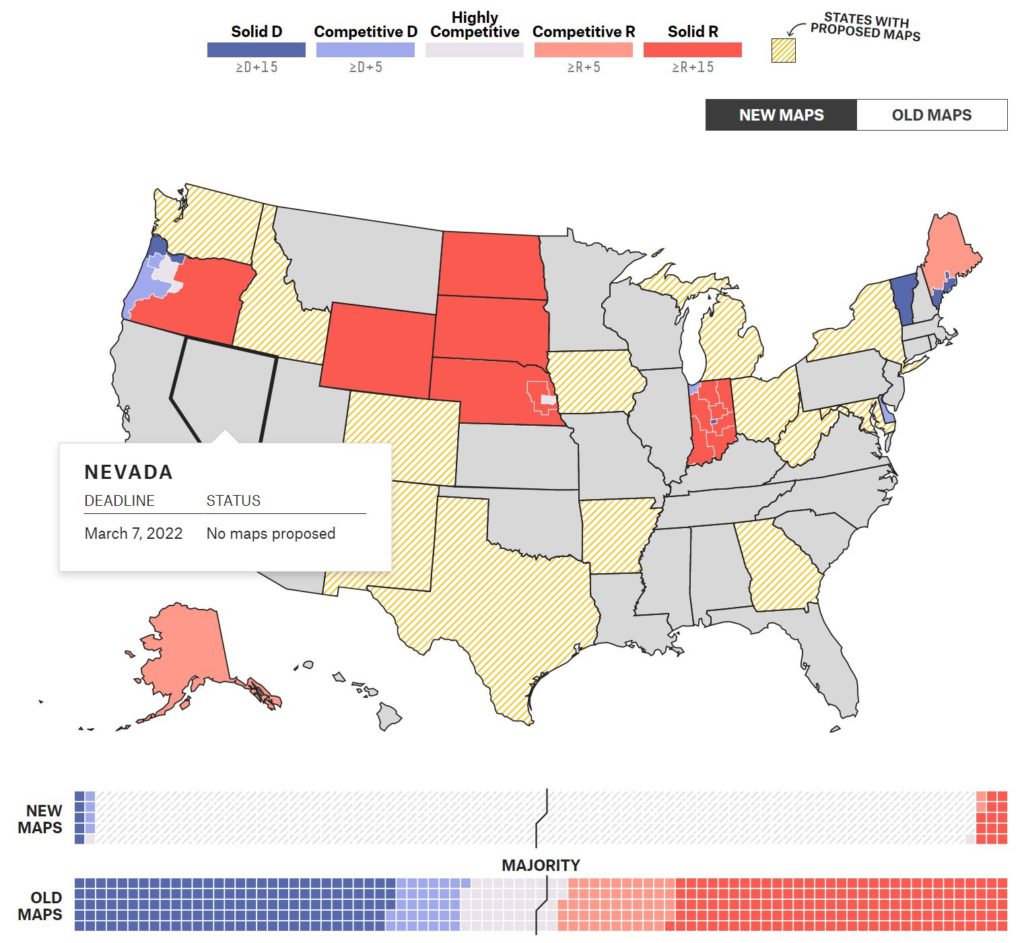
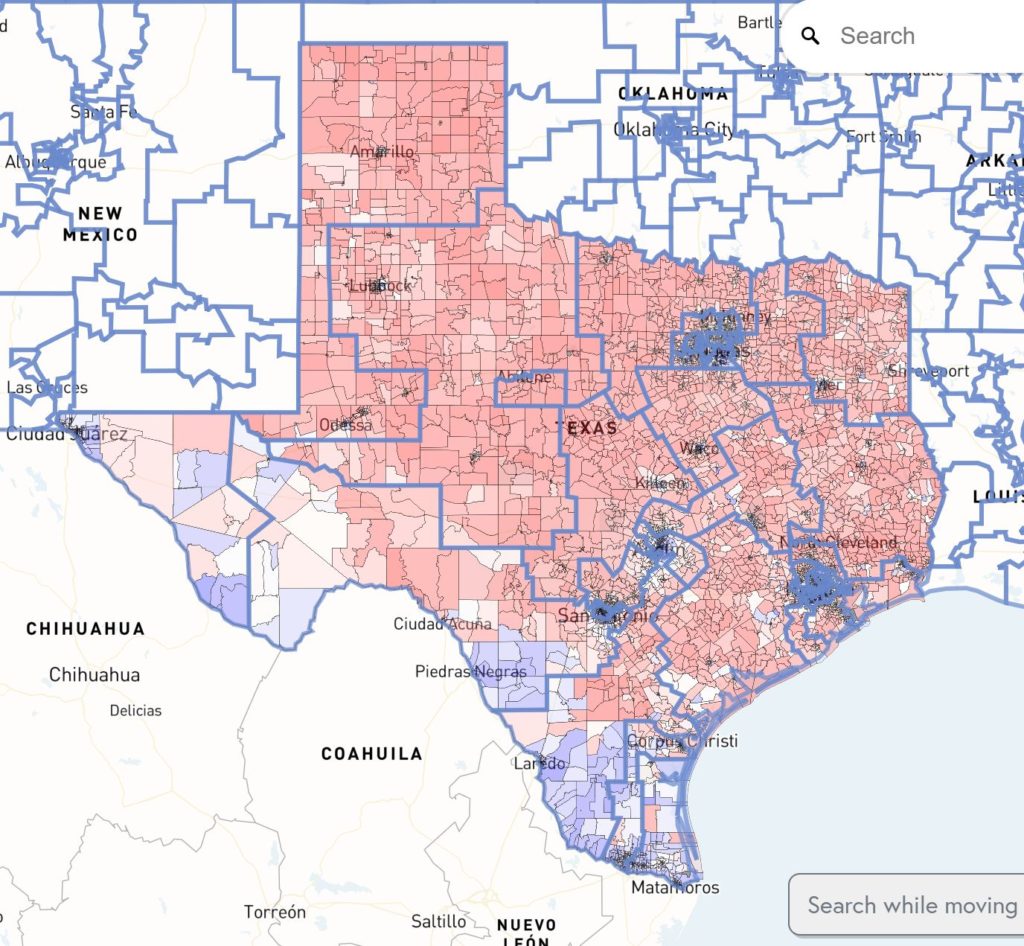
5. FiveThirtyEight’s “What Redistricting Looks Like In Every State”
FiveThirtyEight’s “What Redistricting Looks Like in Every State” has the most comprehensive set of maps on this list. Users can look at proposed maps and approved maps and see how far each district leans on the political spectrum.
Use this tool to track proposed congressional maps (and look at old congressional maps) to see whether they might benefit Republicans or Democrats.
What Redistricting Looks Like In Every State
Tracks proposed congressional maps for every State in the U.S.
See How the partisan makeup of each state has changed and when we can expect new state maps. Additionally, compare the old maps to the new maps to see what’s changed.
Tool created by FiveThirtyEight.com.
6. DistrictR
DistrictR allows users to draw their own districts and maps using a set of building blocks such as precincts or block groups.
Created by the MGGG Redistricting Lab, DistrictR is a free, easy, and creative tool that puts map creation in the hands of the public.
Let’s users draw their own congressional districts.
Users can draw their map, mark places of interest, share them, and submit them as public input (in some cases).
Tool created by MGGG Redistricting Lab.
7. GerryMander: A Voting District Puzzle Game
GerryMander is a voting district puzzle game where users can help the “blue team” or “red team” win by drawing or gerrymandering a proposed district.
GerryMander was created by GameTheory to demonstrate partisan gerrymandering through a simple, fun, and easy-to-use tool.
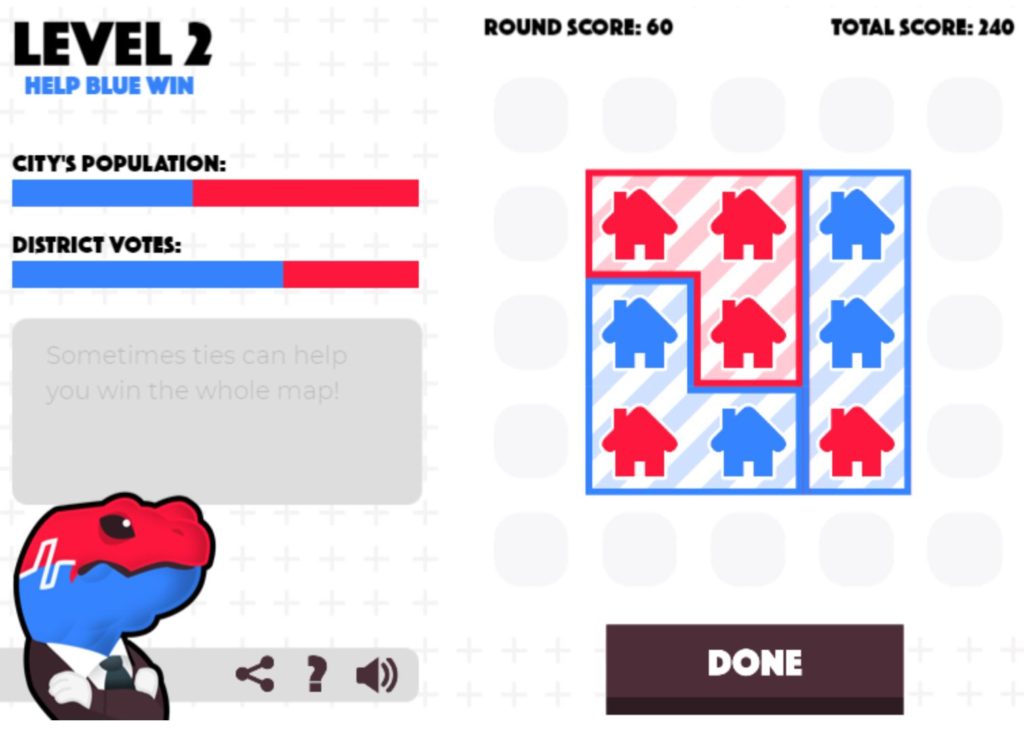
GerryMander: A Voting District Puzzle Game
Play the game to see how gerrymandering can be used to rig an election.
Use real world strategies such as cracking and squashing to beat each level. Each puzzle that’s solved takes you to a harder level with a more difficult puzzle to gerrymander.
Game created by GameTheory.
8. Representable
Representable is a tool that allows users to draw their own maps, districts, and communities of interest. Their primary mission is to give communities a voice to combat the effects of partisan gerrymandering.
The tool makes use of public information to map and visualize district information.
Observe and draw district maps.
Find a state or community and add layers (such as school districts) and election data to build and visualize an informational map.
Tool created by Representable, a Princeton project.
Are There Other Interactive Gerrymandering Tools?
Are there more interactive gerrymandering tools available that aren’t listed here? Send us a message and we’ll get it added to the list.