EPA EJSCREEN: The Environmental Justice Screening and Mapping Tool: Article by John Garner
According to the Environmental Protection Agency (EPA), environmental justice is defined as the “fair treatment and meaningful involvement of all people regardless of race, color, national origin, or income, with respect to the development, implementation, and enforcement of environmental laws, regulations, and policies.”
To summarize, environmental INJUSTICE refers to the fact that poor communities (whether low-income or minority) are subject to historically bad and sometimes purposeful environmental practices that subject them to hazardous living conditions — and environmental JUSTICE is a means to remedy those environmental practices.
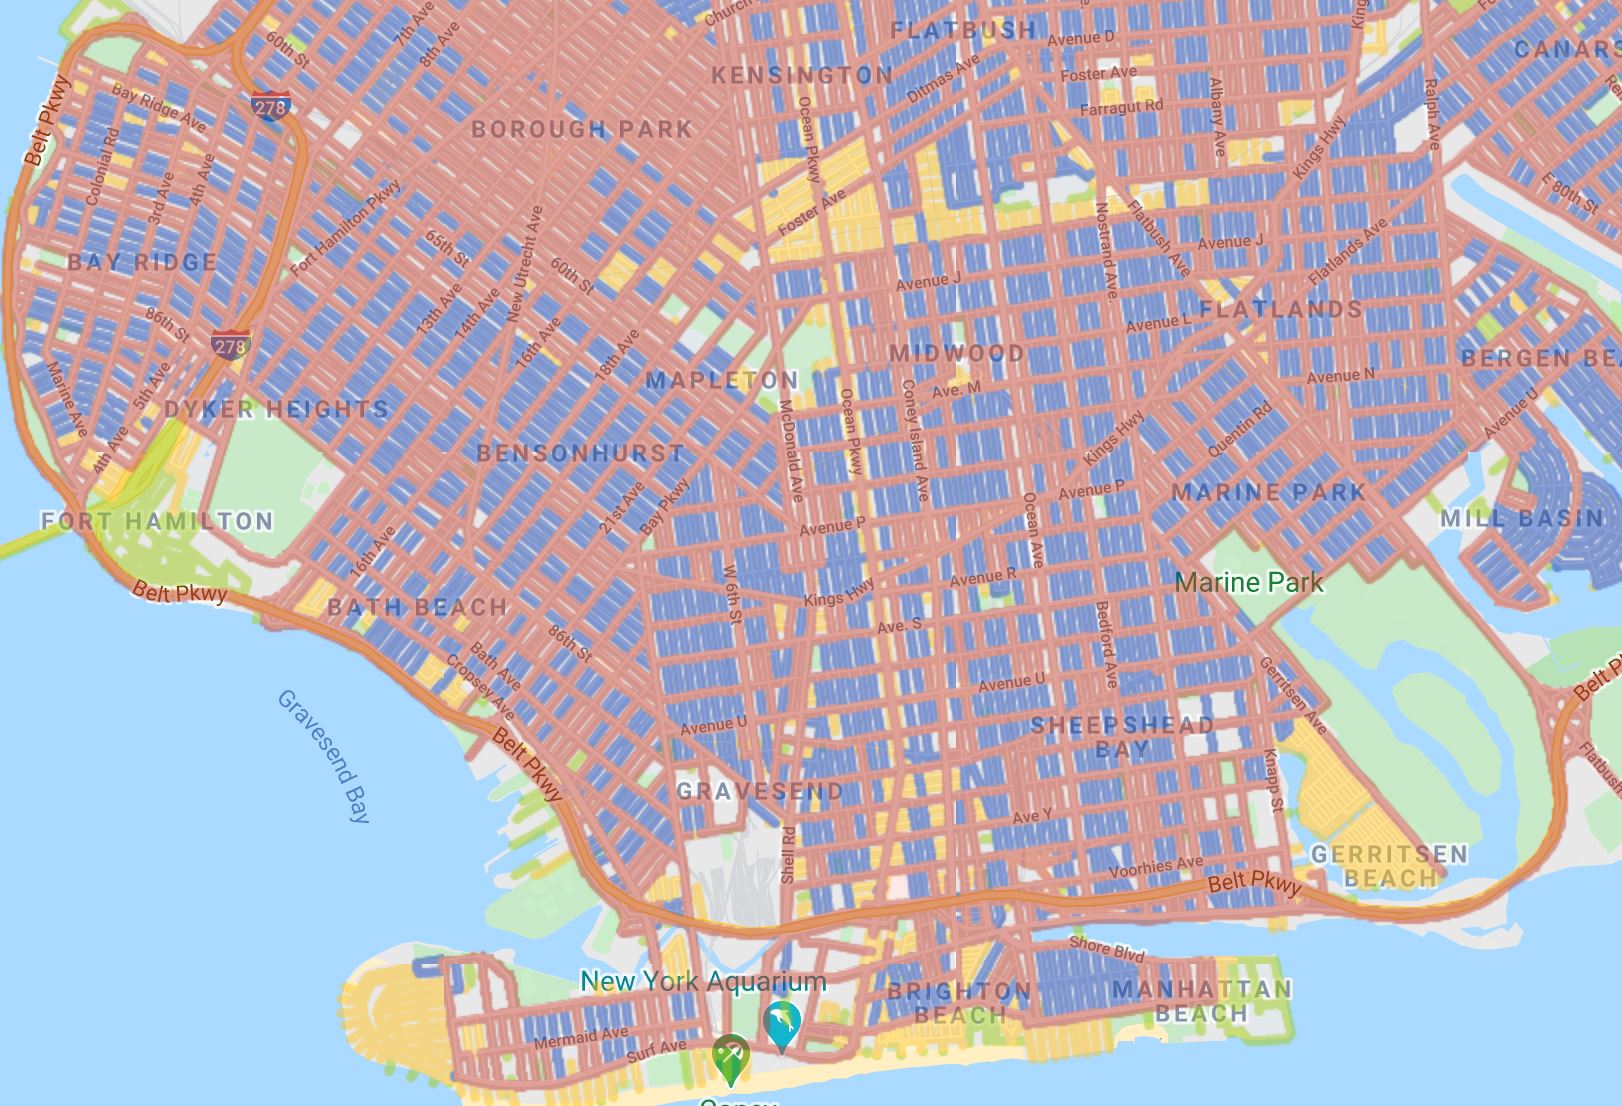
Take, for example, a low-income community that lacks street trees for shade or is subject to intense urban heat when their neighboring communities are not. Or, imagine a city where the poorest communities are adjacent to waste disposal sites or industrial plants. In all of these instances, the poor are essentially hazardous byproducts, because unlike their wealthier counterparts, they typically don’t have the means or know-how to fight back.
The good news is that the EPA and other organizations are doing their best to combat the problem. And with their new Environmental Justice Screening and Mapping Tool, they’re finally able to show communities and community leaders the true extent of environmental injustice.
EPA’s Environmental Justice Screening and Mapping Tool
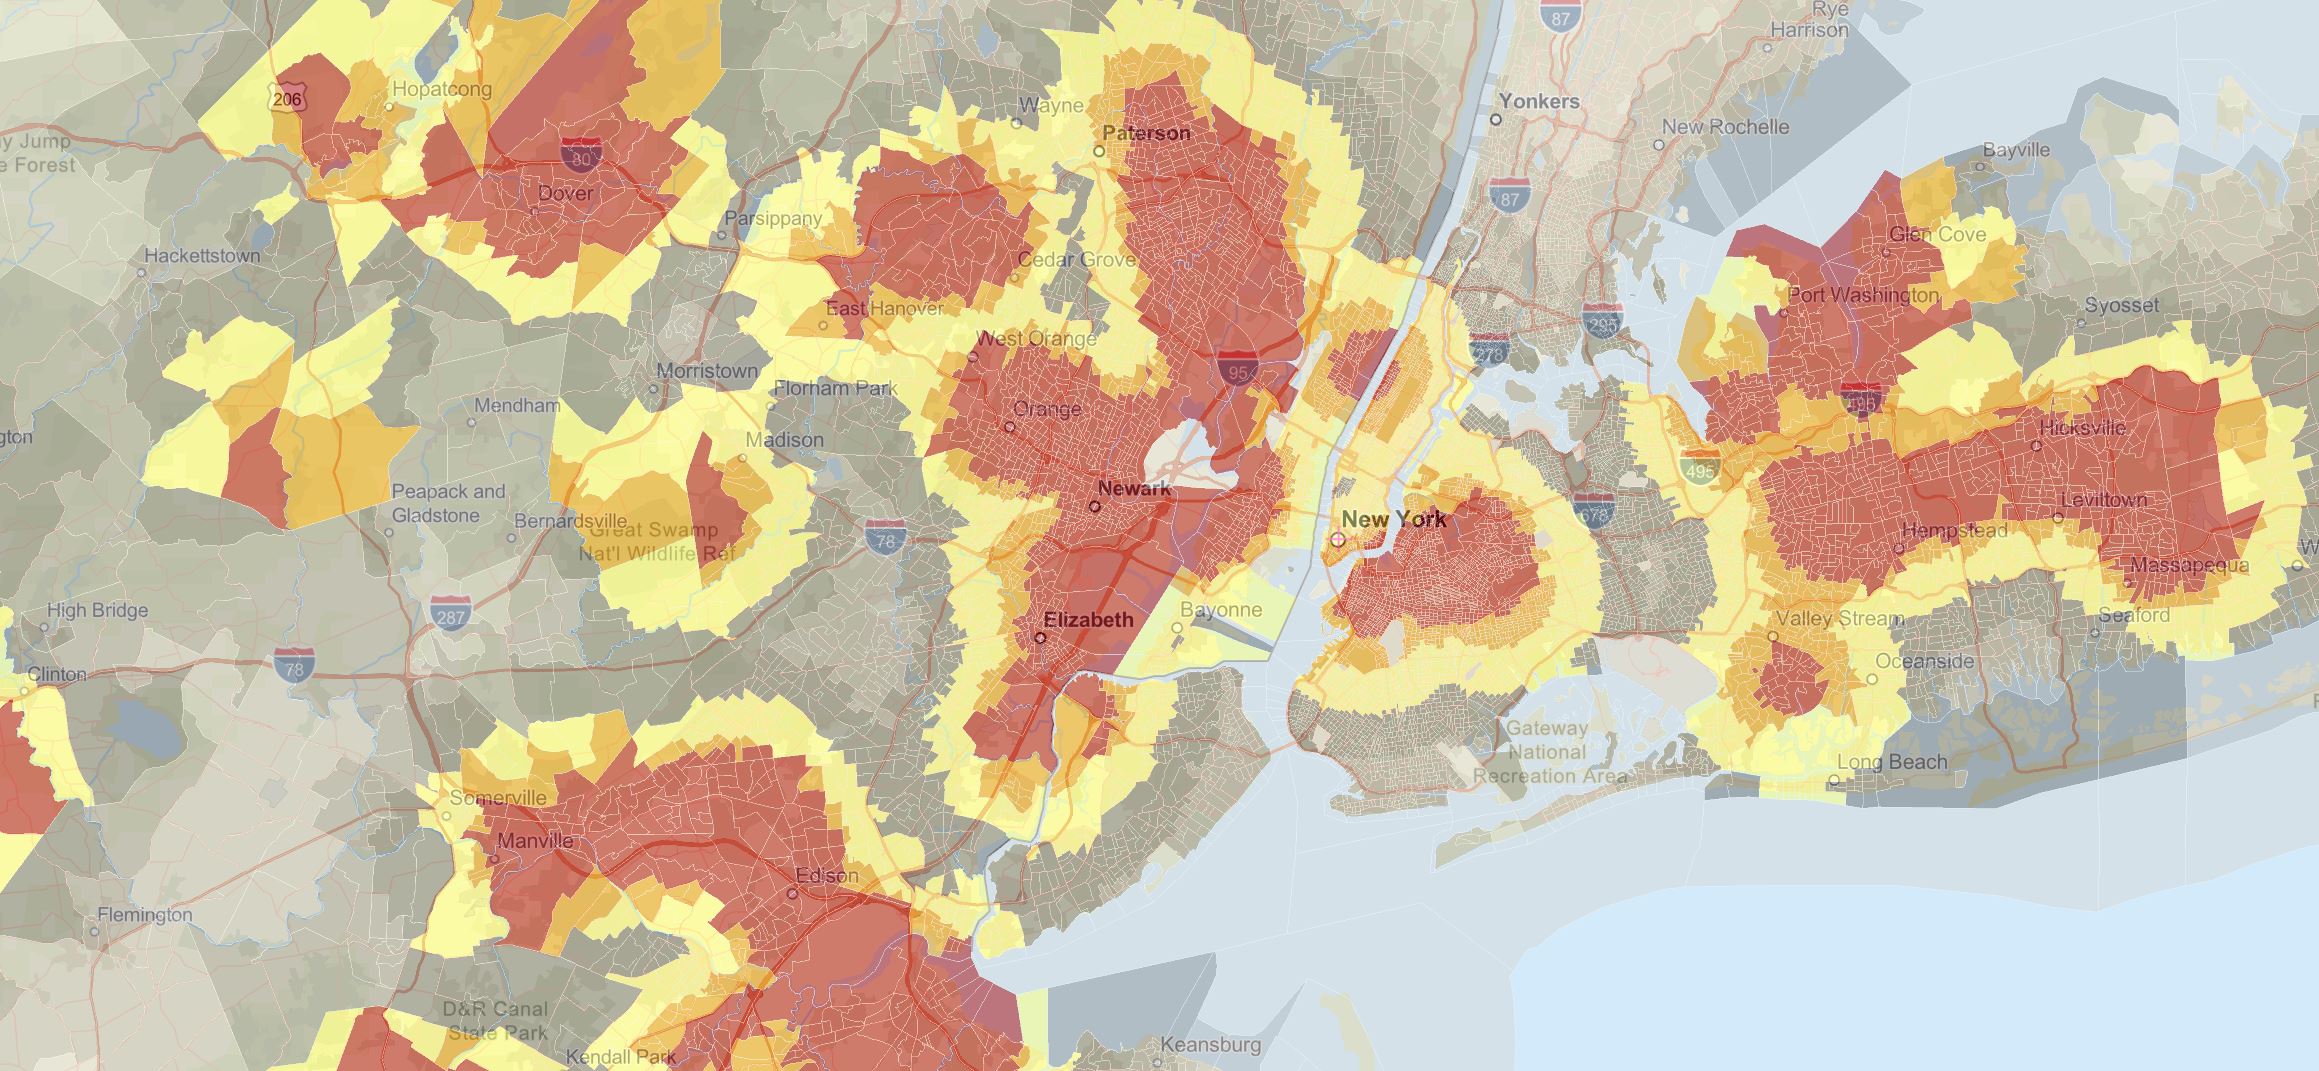
This Environmental Justice Screening and Mapping Tool was created to provide demographic and environmental information to identify vulnerable communities that are disproportionately impacted by environmental hazards.
To make EPA’s environmental justice work more transparent and, more importantly, more accessible to stakeholders and decision-makers, EPA made use of its competencies by applying environmental justice principles and approaches to create a singular environmental justice tool.
The screening tool includes 11 environmental factors, 7 demographic factors, and a variety of environmental justice indexes. Each of the indexes can be combined with a particular demographic factor or environmental factor.
How was the Tool Developed?
Since the signing of Executive Order 12898 in 1994, The EPA has used a variety of resources to better understand potential disproportionate environmental impacts and other significant environmental justice concerns for populations across the United States. And in the process, several mapping tools were built.
But as technology advanced, the EPA realized the opportunity and the need to develop a single, consistent mapping tool that could serve a greater purpose. Thus, EJSCREEN was developed and made available to the masses.
The main goal in developing EJSCREEN was to build on the Environmental Protection Agency’s experience in developing screening tools and to provide a new, user-friendly screening tool that provides information on a more balanced basis.
Officially developed in 2010, the EPA started using it for internal purposes in 2012. And it wasn’t until 2015 that it was released to the public.
EPA EJSCREEN: How The EPA Uses It
The EPA uses the Environmental Justice Screening Tool (EJSCREEN) as a preliminary step when deciding whether to take specific actions (such as advocacy work) that may affect communities. According to their website, these actions include:
- Informing outreach and engagement practices
- Implementing aspects of the following programs:
- permitting
- enforcement
- compliance
- voluntary
- Developing retrospective reports of EPA work
- Enhancing geographically based initiatives
Their website also makes it clear that it doesn’t use if for:
- As a means to identify or label an area as an “EJ community”
- To quantify specific risk values for a selected area
- To measure cumulative impacts of multiple environmental factors
- As a basis for agency decision-making or making a determination regarding the existence or absence of EJ concerns
How to Use EJSCREEN
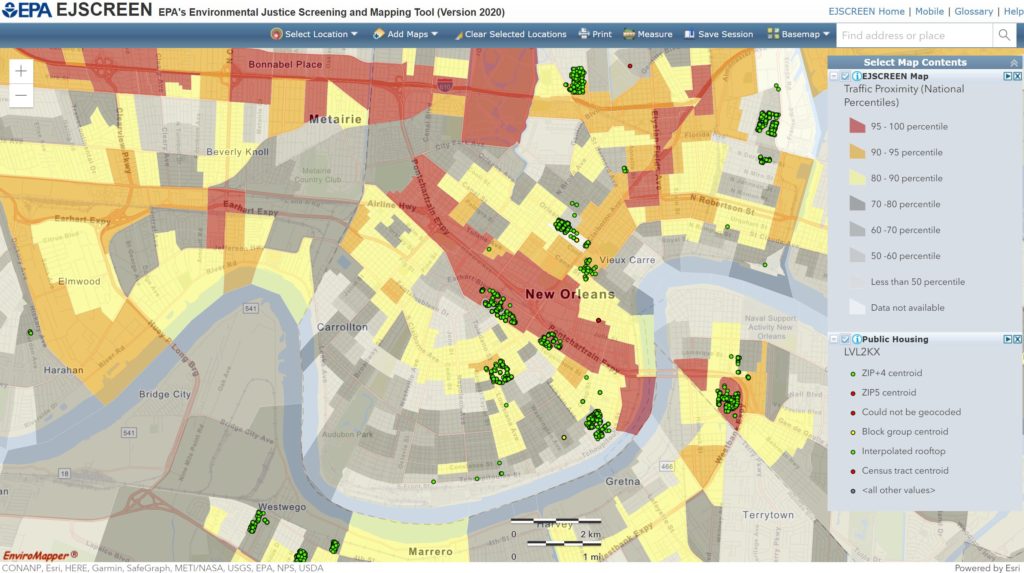
To use EJSCREEN, launch the tool and enter your desired location — you can input your location information at the top right or you can “select location” on the top left. Either one will work. If you are using a mobile device, launch the tool here.
When you open the tool, you’ll notice a few headings at the top (this is only describing the desktop version, not the mobile):
- Select Location: Select a desired location
- Add Maps: Add desired map layers
- Clear Selected Locations: Removes anything selected
- Print: Prints your customized map
- Measure: Measures the distance between points
- Save Session: Save your locations to review them later
- Basemap: Choose your background (satellite, streets, topographic, etc.)
- Find Address or Place: Locate or find a specific address
While most of the headings are pretty straightforward and self-explanatory, adding maps can be a little confusing.
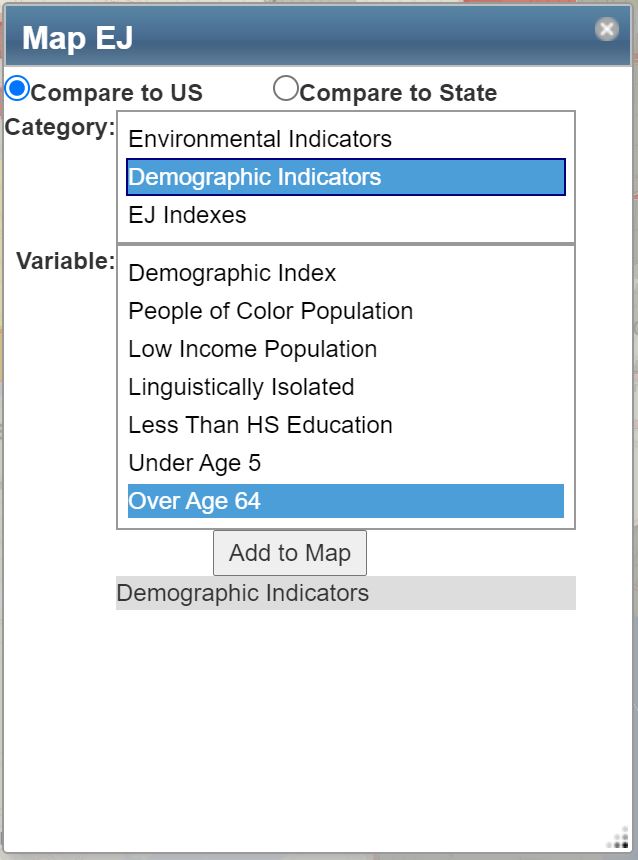
To clear up any confusion, click “Add Maps” and hit “EJSCREEN Maps” — then select “Compare to US” or “Compare to State” at the top. Then select a category (environmental, demographic, or EJ Indexes). Once a category is selected, you’ll notice that the variables change with it. Select the variable that you want and click “Add to Map.”
Once you’ve added a category and variable, you can add other layers. Click “Add Maps” again to observe the options. If you want to get more specific with demographic information, click “More Demographics” and you can change the visuals and use ACS data, 2010 census data, or 2000 data (2020 census data will probably be added soon).
If you want to put another layer on top of what you’ve selected, click “Additional Layers” and add schools, public housing, parks, prisons, etc.
Each layer can be turned off and on on the right-hand side — hit the checkbox to take away or add the layer.
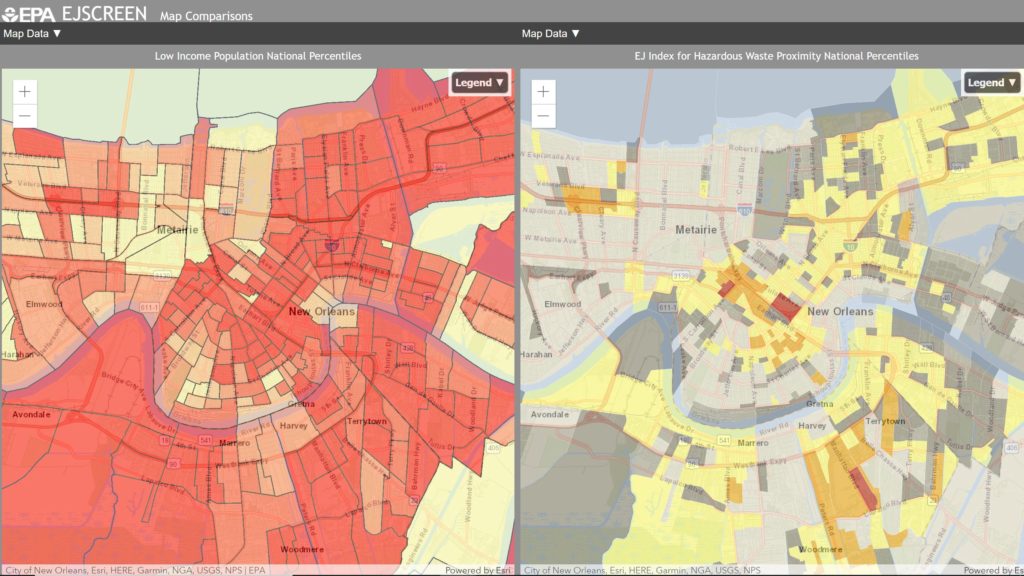
Side-by-Side Maps on the EJSCREEN Mapper
One of the more unique features of this tool is that you’re able to compare maps next to each other in one single frame.
Similar to the option explained above, simply click the drop-down “Map Data” on the left-hand side of each map to change the category and variable. This helps you visually compare patterns, similarities, and changes.
EJSCREEN Data and EJSCREEN Data Download
If you would like to add your own data or shapefile to visualize, you can, but it can be a little complicated if you’re not familiar with Geographic Information Systems (GIS).
If you click “Add Maps” and then expand “Search for Maps” at the bottom, you’ll notice that there are two options: “Search Geoplatform” and “Add Map Services.”
The “Search Geoplatform” option allows you to search content on ArcGIS Online but you must have an ArcGIS account to access it. The “Add Map Services” option allows you to add publicly available data from the web through a URL.
If you’re looking for downloadable data files and documentation, those can be downloaded here.
Luckily for us, there is an EJSCREEN user guide that explains this better — access it here and go to page 48.
This is NOT a Final Decision-Making Tool
EJSCREEN is useful in identifying potential EJ concerns, but it shouldn’t be used as a final decision-making tool.
Since the predictive values for small geographic areas are subject to substantial uncertainty, users should be mindful of this lack of precision in the data when using the tool. This sort of information is often misinterpreted as a predictor of outcomes for individuals, but the data itself has only been gathered specifically for statistical purposes. Therefore it’s essential to understand the limitations for appropriate interpretation and application.
So, before using EJSCREEN, please make sure that you have read the documentation that is available on the EJSCREEN website. Also note that it doesn’t provide data on every environmental impact and demographic factor that may be relevant to a particular location.
EPA Environmental Justice Map
In final thoughts, this is an incredibly powerful and useful environmental justice map. Not only does it have the ability to display the information in an easy-to-read format, but it allows you to do side-by-side comparisons for quick and easy analysis.
Additionally, users can compare the data to different states, EPA Regions, or the Nation as a whole. And whether you’re using the tool for personal research, assistance, or supplementary decision making, it’s undoubtedly the best environmental justice tool out there.
To see more interactive tools like this one, explore our web mapping applications page where you’ll find hundreds of useful tools related to climate change, social justice, housing, and more.