urban heat in the northeast

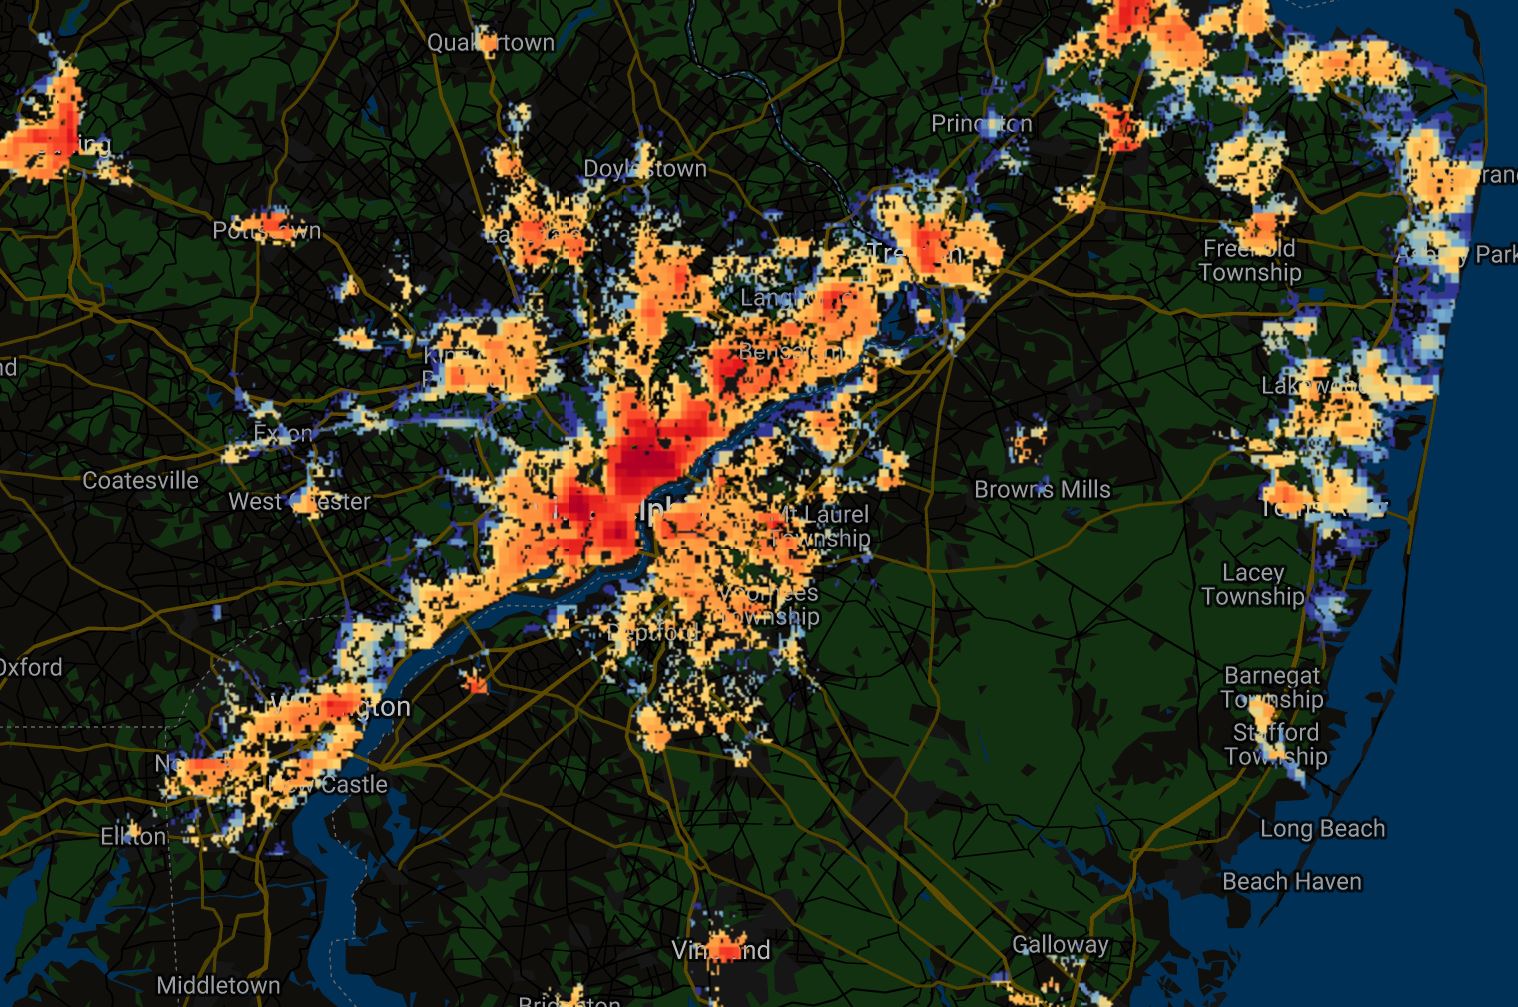
SUHII or “Surface Urban Heat Island Intensity” is now Mapped for Every City in the World

SUHII, which stands for “Surface Urban Heat Island Intensity,” has been globally mapped by authors and creators T. Chakraborty and X. Lee with Yale University’s Center for Earth Observation. As the world is getting hotter, our urban areas are suffering the most, with highly developed neighborhoods sometimes climbing 15°F to 20°F hotter than their neighboring …

EXPLORE THE COMPREHENSIVE INTERACTIVE DATABASE OF THE ISRAELI-PALESTINIAN CONFLICT

Interactive Maps to Better Understand the Israeli-Palestinian Conflict

With the Israeli-Palestinian conflict raging on, we’ve put together a quick list of interactive maps to better understand what’s happening in Israel, the West Bank, and the Gaza Strip. And, as always, feel free to explore more web mapping applications and interactive data tools found on this site. 1. Conquer and Divide: Interactive map illustrating …

redlining in Atlanta

Mapping Inequality: Redlining in New Deal America

Mapping Inequality: Redlining in New Deal America Tool Review Between 1935 and 1940, in the midst of the Great Depression recovery, the Home Owner’s Loan Corporation (HOLC) used data from local real estate appraisers, developers, and lenders to assign housing “grades” to residential neighborhoods across the U.S. in an effort to show a particular neighborhood’s …

poverty in america

Neighborhood Poverty In America: Using The Opportunity Atlas

Neighborhood poverty in America may be difficult to pinpoint, but it’s certainly not impossible. The Opportunity Atlas, created by the U.S. Census Bureau and Opportunity Insights, is an interactive map that successfully identifies which neighborhoods provide children the best chance of rising out of poverty. Using anonymous data and following 20 million Americans from their …

nyc tree map

Check Out This Interactive New York City Street Trees Map

New York City may have lost a lot of trees since its early founding, but there’s signs of hope in the Big Apple with the new “New York City Street Trees Mapper.” The city’s latest tree census includes, “the world’s most accurate and detailed map of a city’s street trees,” and it’s ushering in a …

Are Gun Policies Really Working? Compare Outcomes Using This Tool

Are gun policies really working in America? According to the Gun Policy Outcome Explorer by the RAND Corporation, it depends on who you ask. While gun possession is largely (and constitutionally) protected in the United States, the often tragic results of such possession – firearm homicides, murders, mass shootings — aren’t always discussed equally. And …

rat in new york

New York Has A Rat Map And It’s Pretty F’n Awesome

New York has a rat map and it’s pretty F’n awesome! Officially known as the Rat Information Portal (or more fittingly, the R.I.P.), the “NYC rat map” lets you visualize the insane amount of rats in New York City. Not only does it show you active “hot spots” across the City, but you’re actually able …

Capitol Rioters

Hate Groups In the United States: Using The SPLC Tool

Hate groups in the United States come in many different forms — white nationalist, anti-LGBTQ, skinheads, neo-confederates, etc. — but how many of them actually exist? Well, according to the Southern Poverty Law Center (SPLC), who has been fighting hate groups since 1971, there are over 1600 extremist groups and 940 hate groups currently operating in …

birds on ice bergs

Visualize Sea Level Rise With NOAA’s New Tool

The National Oceanic Atmospheric Administration (NOAA) has created a user-friendly tool to visualize the potential impacts of sea level rise on communities. Called the Sea Level Rise Viewer, the tool allows you to pick an area (in the U.S.) and explore potential inundation through best and worst case scenarios. Additionally, you can use it to …

The Many COVID Tools Available

As of this writing, COVID-19 has killed 296,000 Americans and more than 108,000 are hospitalized. Needless to say, deaths are likely to substantially increase in the coming months. The good news? A vaccine is days away. The bad news? Distribution looks pretty difficult. In the meantime however, there are several tools you can use to …